Summary: Waterfall charts are useful to show the growth or decline of a metric over time.
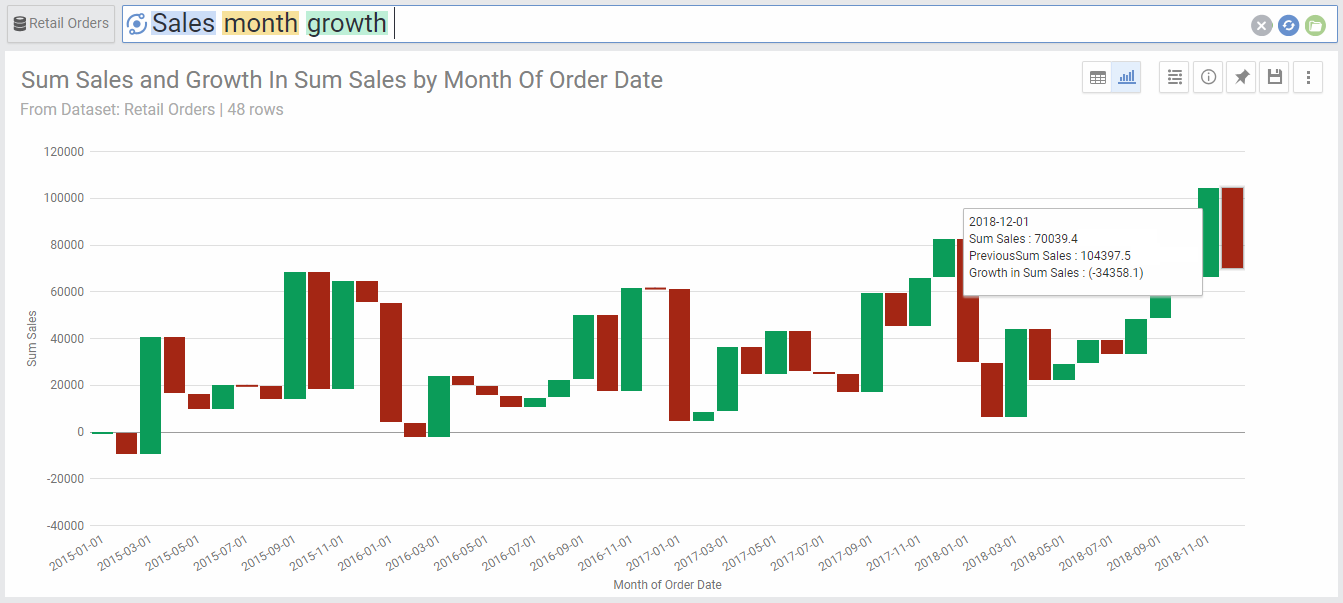
Waterfall charts are the default view for questions regarding growth over a time period. You need a metric, dimension and growth keyword to use the waterfall chart. Green columns denote positive growth and red columns denote negative growth. According to your question, the growth can be measured in absolute or percentage terms, and can compare the current period to different kinds of previous periods (e.g. each month compared to previous month, each month compared to same month last year, aka Year on year, etc…).
Waterfall Chart Options
| Option | Explanation |
|---|---|
| X Axis | The date dimension used for the X Axis. |
| Series | The Metrics used to draw the columns of the waterfall chart. |