Summary: AnswerDock provides natural language narratives and additional insights in in the information > insights section.
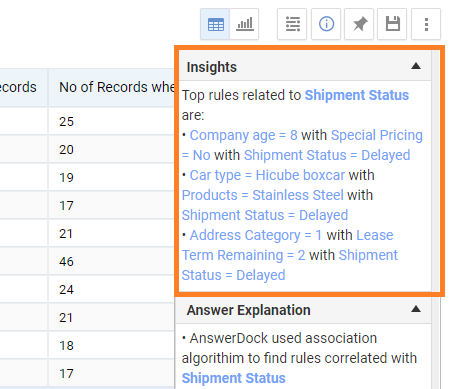
The answer information menu (accessed through the the i icon) can sometimes contain a dedicated insights section. This section contains the answer and some extracted insights for certain types of questions. For example, a correlation question of “What increases revenue”, would show a dedicated insights sections listing down the top 3 factors increasing revenue, as a direct answer to your question. The answer is provided in a natural language narrative style that makes it easier to understand.
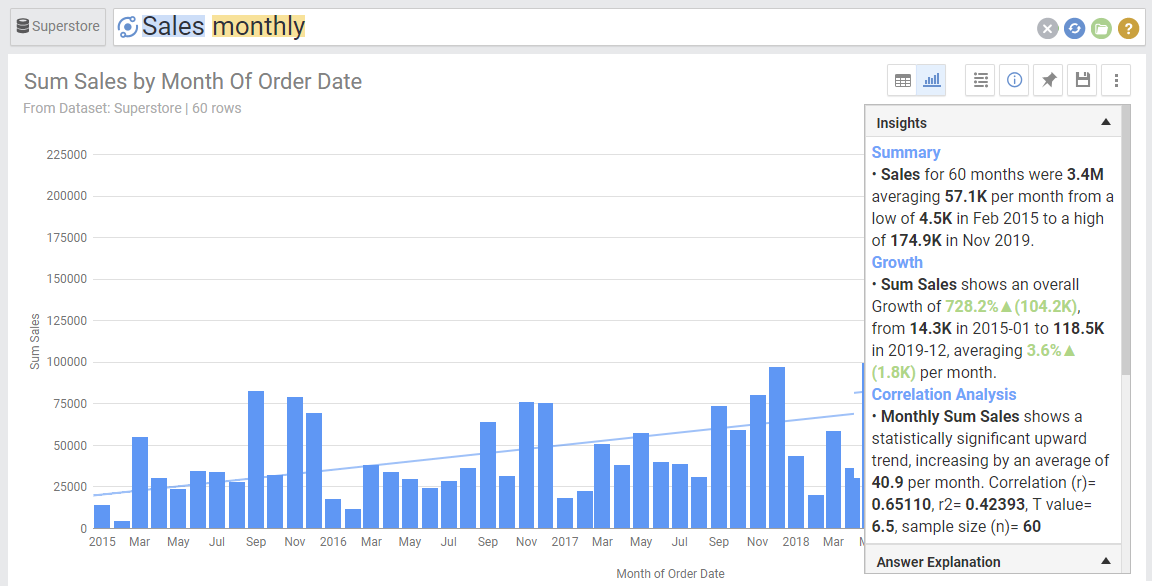
The section can also provide extra information that complements the visualized answer. For example, “Sales Monthly” will show a chart of sales grouped by the month of the default date field in the dataset. In addition, the insights section will provide more information regarding the overall sum, overall average, minimum and maximum values. It also provides growth information (Overall growth, compounded growth,..) and correlation analysis that shows wether there is a statistically significant trend upwards or downwards.
Note that the average growth provided in the Growth section is different than the average growth provided int he correlation section. In the example below, the actual average monthly increment was ~1.8K, which is the difference between the first and last values, divided by the number of months. The average growth in the best fit section provides the slope (growth) of the best fit regression line across all the monthly values. This is useful to show the growth trend and to show if you are currently performing below or above this trend line.