Summary: You can let AnswerDock identify numerical columns that drive a specific metric by simply asking: What drives [Y]?
In AnswerDock, you can identify all columns that are highly correlated with a certain metric. For example, let’s say we have an insurance dataset and we would like to identify factors that are driving the premium up. For such an analysis, we would simply ask
- What increases Premiums?
Using Natural Language Processing, AnswerDock will identify the above question as a regression analysis question and will run the analysis with every numerical column in the dataset, then rank the results by the strength of the correlation, as below:
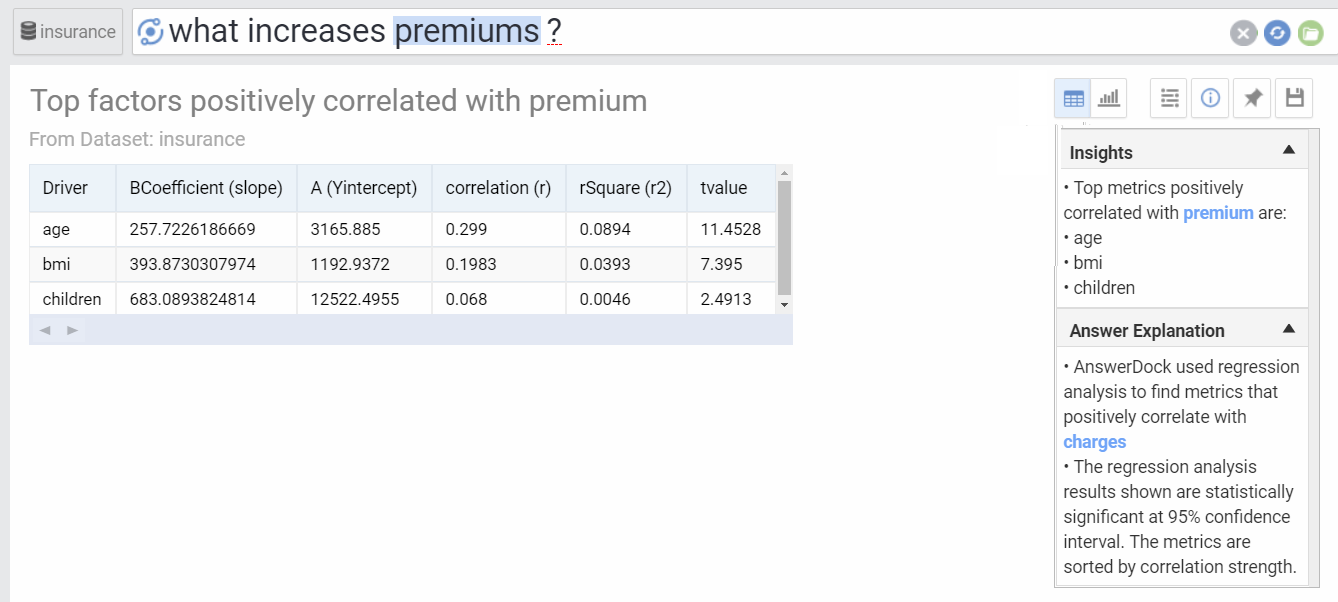
In the above table, all numerical columns that are positively statistically correlated with Premiums are listed. Below if the explanation of the answer:
- Driver: The numerical column name in your dataset, identified to be correlated with the column being analyzed (Premiums).
- B coefficient: This is the Slope of the trend line between the driver column (x axis) and the column being analyzed (y axis). It represents how much does the y axis change for every unit change in x axis. for example, the first driver in the above example shows that as the customer age increases by one year, the charges increase by 257 on average
- A Coefficient: This is the intercept of the trend line drawn between the driver column (x axis) and the column being analyzed (y axis). This is not very important in the analysis, it just represents the value of the driver analysis (x axis) when the column being analyzed is zero.
- Correlation coefficient (r): This is a measure of linear association between two columns or variables. Values of this correlation coefficient are always between -1 and +1. The higher the coefficient (whether above or below zero), the stronger the positive or negative correlation. A coefficient of +1 means there is perfect positive association between the variables, and a coefficient or -1 means there is a perfect negative correlation. In our example above, the coefficient is 0.299.
- R-squared (r2): This is a statistical measure of how close the data are to the fitted regression or trend line. The value will range between 0 and 1. The higher the value is, the more the model explains the variability of the y axis column data around its mean.
- T value: This represents the r coefficient (explained above) divided by its standard error (an estimate of the standard deviation of the coefficient, the amount it varies across cases). The T value is important as it is used to determine whether the correlation is statistically significant or not. If the Correlation is not significant, AnswerDock would not have returned the column as a driver.
Asking the Question in Multiple Variations
As in the case for other questions, you do not need to memorize a specific wording or sentence to ask about the correlation, AnswerDock’s NLP engine is able to understand the different variations of your question. For example, AnswerDock will also understand the below questions:
- What drives Premiums up?
- What factors make Premiums Higher?
- What drivers positively correlate with Premiums?
Asking About Negative Correlation
You can alternatively ask about drivers negatively affecting a certain metric. For example:
- What drives Premiums lower?
- What decreases Premiums lower?
In this case, AnswerDock will look for columns where an increase in that driver would result in a decrease in Premiums (negative correlation).
Asking About Correlation
You can also ask about the existence of correlation in general, whether positive or negative. For example:
- What drives Premiums?
- What factors correlate with Premiums?
In this case, AnswerDock will look for columns where an increase or decrease in that driver would result in a statistically significant change in Premiums (positive or negative correlation).
Applying Data Filtering Criteria
You can apply date filters, column value filters or advanced filters to the above question, same as any other search or question on AnswerDock. For example:
- What drives Premiums 2018?
- What drives Premiums for male customers
- What drives Premiums MonthlyIncome>2000
Limitations on analysis
At this stage, AnswerDock does not support comparison keywords with regression analysis. The following questions are not supported:
- What drives Premiums 2018 Male vs Female?
In order to do the above, you would need to run two separate analysis:
- What drives Premiums 2018 Male ?
- What drives Premiums 2018 Female?