Summary: Difference Pie charts are a variation of pie charts that are useful to compare percentages of a metric between two difference segments.
Difference Pie Charts are useful in showing how the share of a certain metric changes between two different segments. The segments can be date (e.g. this month vs last month) or any other type of dimensions (e.g. country, category, etc..). Difference Pie Charts need one metric and two dimensions, with the second dimension having two values only. They can also have two metrics (to compare between them such as actual revenue vs expected revenue) with 1 dimension.
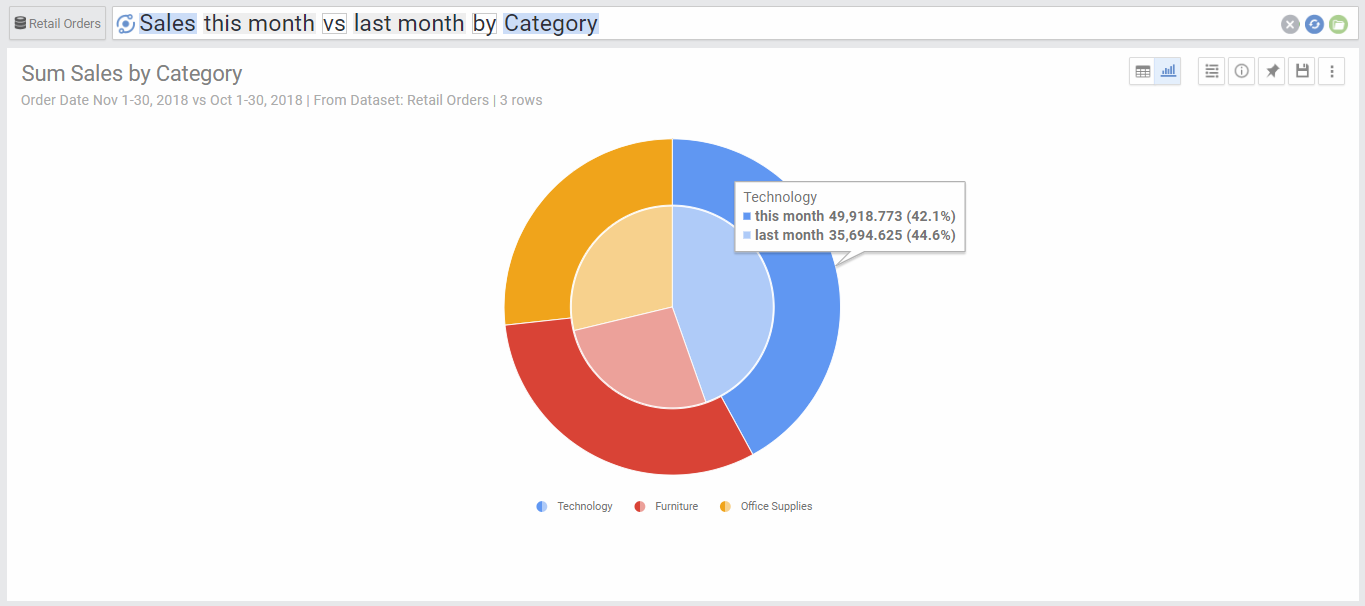
Chart Options
| Option | Explanation |
|---|---|
| Switch Inner and Outer Circles | This switches the fields designation of the inner and outer circles of the pie chart. |
| Numbers Format | Change the format of the numbers used in the data labels and on-hover data call-outs of the chart. |
| Legend Location | Select the location for the legend that shows the color coding of the colored segments. |