Summary: Time series analysis allows you to plot metrics over time using time intervals such as Monthly or Yearly. You can also use date filters to easily filter for a specific date period.
Time series analysis shows the trend of metrics over a time interval in the X axis. With Answerdock, you only need to put the metric( e.g. sales) and the interval (e.g. monthly) to start with your Time Series Analysis. You can also add a date filter and a secondary dimension to your question or search. Below is a quick explanation of time intervals and date filters.
Time intervals
Time intervals group dates falling into specific time intervals together to create a date dimension. You can use any of the following to denote a time interval:
| By Minute | Quarterly | By week of month |
| By second | Yearly | By week of quarter |
| Daily | By day of week | By week of year |
| Weekly | By day of quarter | By month of quarter |
| Monthly | By day of month | By month of year |
| Hourly | By day of year | By quarter of year |
By default, time intervals default to the primary date set for the dataset in the settings page. If you have more than one date field in your dataset, you can change this date by two methods.
1- Lookup the correct time interval to the specific date from the search guidance menu
2- Type the date field that you need the interval to relate to next to the time interval
Note that AnswerDock supports fiscal calendars, and you can edit the properties of any date column in your dataset to make it refer to a fiscal calendar with a start date other than Jan 1st.
Date filters
In Time Series Analysis, date filters can come handy. There is a complete section in this chapter regarding filters. In summary, you can type almost any date filter you can think of and AnswerDock will be able to understand it. A few examples are as below:
- Last year, this quarter, month to date
- After may 19 this year
- 5/13/2008-6/14/2017
- before 11/20/2017
- from jan 1 2018 to may 14 2018
- last 7 days
- 2 months ago
- Last x days including today
- Last y months including this month
- This month exclude today
- starting jan 2017 and ending february 2018
- Q1 2018
- January 2017
- 2013-2018
- etc…
You can also see more examples of date filters in the Keywords Reference Guide
Example of Time Series Analysis
Using Two Interval Keywords
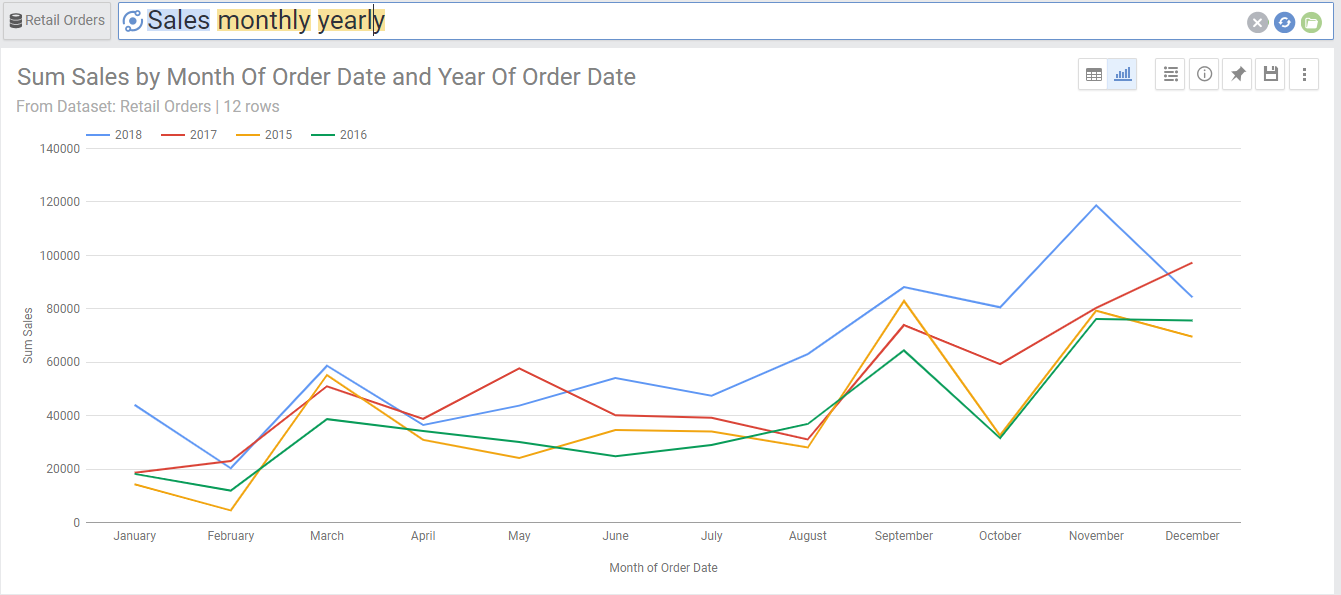
Using two interval keywords gives you an interesting look at the evolution of performance over time. For example, you can ask:
- Sales Monthly Yearly
This will Plot the sales for each month, represented by different lines for each year.
You can ask different variations of the above question, such as:
- Sales Monthly quarterly
- Sales Daily Yearly
- Sales Weekly monthly