Summary: You can analyze the relationship between two numerical columns in your dataset by asking asking does x relate to y.
In AnswerDock, you can analyze the correlation between variables easily by asking a question. For example, let’s say we have a dataset of of customers containing age groups and charges. If you are wondering whether older customers are paying higher than younger ones , you can easily verify this by asking:
- How does Age correlate with charges?
Using Natural Language Processing, AnswerDock will identify the above question as a regression analysis between two numerical variables, and present the answer, both in visual and written text:
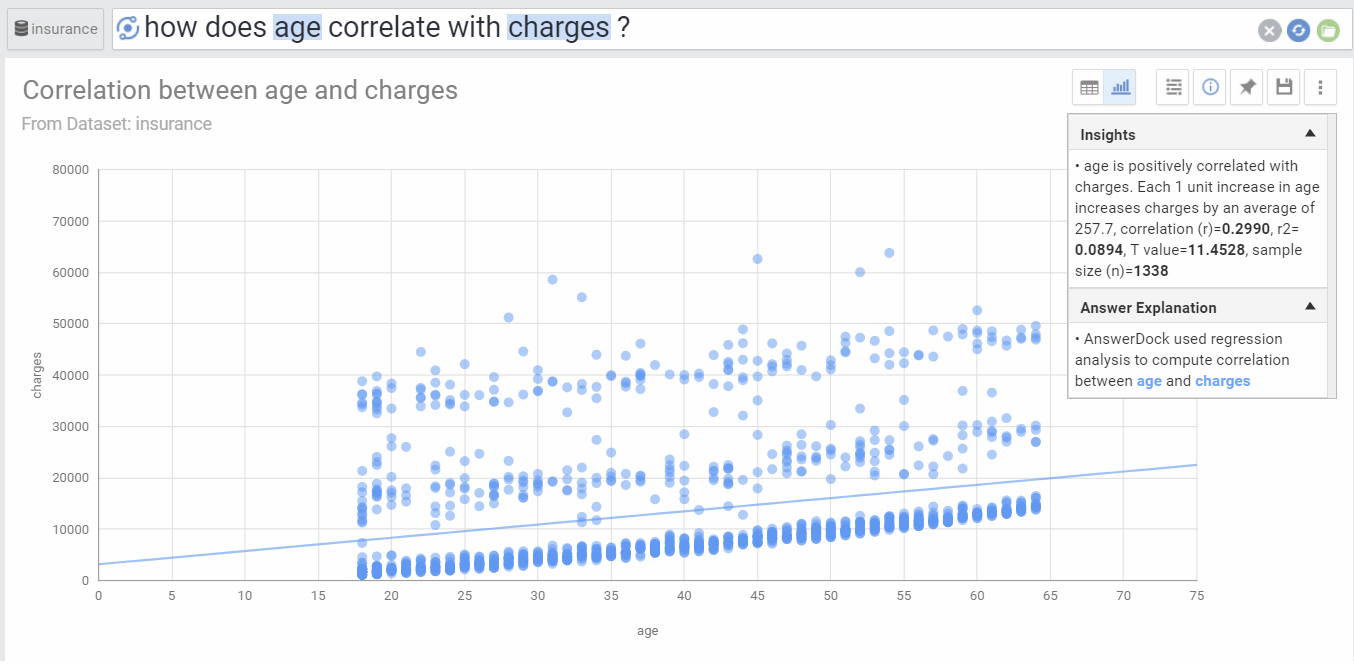
In the above scatter chart, the age is on the X axis and the charges is on the Y axis. A trend line is drawn to show the correlation, its clear that there is a positive correlation between age and charges. The answer info icon presents more information as follows:
- Slope of the trend line: This is how much does the y axis change for every unit change in x axis. This shows that as the customer age increases by one year, the charges increase by 257 on average
- Correlation coefficient (r): This is a measure of linear association between two columns or variables. Values of this correlation coefficient are always between -1 and +1. The higher the coefficient (whether above or below zero), the stronger the positive or negative correlation. A coefficient of +1 means there is perfect positive association between the variables, and a coefficient or -1 means there is a perfect negative correlation. In our example above, the coefficient is 0.299.
- R-squared (r2): This is a statistical measure of how close the data are to the fitted regression or trend line. The value will range between 0 and 1. The higher the value is, the more the model explains the variability of the y axis column data around its mean. In our example, the measure shows how the linear regression model explains the variability of charges based on the customer age.
- T value: This represents the r coefficient (explained above) divided by its standard error (an estimate of the standard deviation of the coefficient, the amount it varies across cases). The T value is important as it is used to determine whether the correlation is statistically significant or not. If the Correlation is not significant, AnswerDock would return an answer stating so.
- Sample Size (N): The number of records in your dataset that were included in the analysis. Note that the scatter chart can only fit 5000 points. So the sample size (n) can be as high as a million records, but the chart visualization will be limited to 5000.
Asking the Question in Multiple Variations
As in the case for other questions, you do not need to memorize a specific wording or sentence to ask about the correlation, AnswerDock’s NLP engine is able to understand the different variations of your question. For example, AnswerDock will also understand the below questions:
- How does Age impact Charges?
- Does Age drive Charges?
- Whats the relation between Age and charges?
Note that the above questions are different than simply asking:
- Age vs Charges?
In the first case, you are asking specifically about the relation between the two columns, and AnswerDock will measure the correlation and all the other related statistical coefficients to determine the answer. In the second case, the question will just generate a scatter chart of age vs charges.
Applying Data Filtering Criteria
You can apply date filters, column value filters or advanced filters to the above question, same as any other search or question on AnswerDock. For example:
- How does Age correlate with charges 2018?
- How does Age correlate with charges for male customers?
- How does Age correlate with charges MonthlyIncome>2000?
Limitations on correlation analysis
At this stage, AnswerDock does not support comparison keywords with regression analysis. The following questions are not supported:
- How does Age correlate with charges Male vs Female?
In order to do the above, you would need to run two separate analysis:
- How does Age correlate with charges Male?
- How does Age correlate with charges Female?