Summary: You can let AnswerDock identify columns that drive a specific dimension to be of certain value by simply asking: What drives [Y] to be [AnyValue]? You can also ask about any outcome by asking questions such as: What drives [AnyOutcomeCondition].
In AnswerDock, you can leverage powerful data mining algorithms to identify trends and insights, through a simple question. For example, let’s say we have an HR dataset with employee information in multiple dimensions regarding job level, working hours, travel frequency, stock options, marital status, etc.. Lets Assume we have a column called attrition, which denotes whether the employee left (attrition = true) or still in the company (attrition=false) Now if we want to analyze the factors that are making people leave, we would just ask:
- What makes Attrition = true?
Using Natural Language Processing, AnswerDock will identify the above question as one requiring rules association algorithm. It will run the analysis with every column in the dataset, then rank the results by their significance. The results show statistically derived decision rules for the most likelihood for a attrition to be ‘true’, as below:
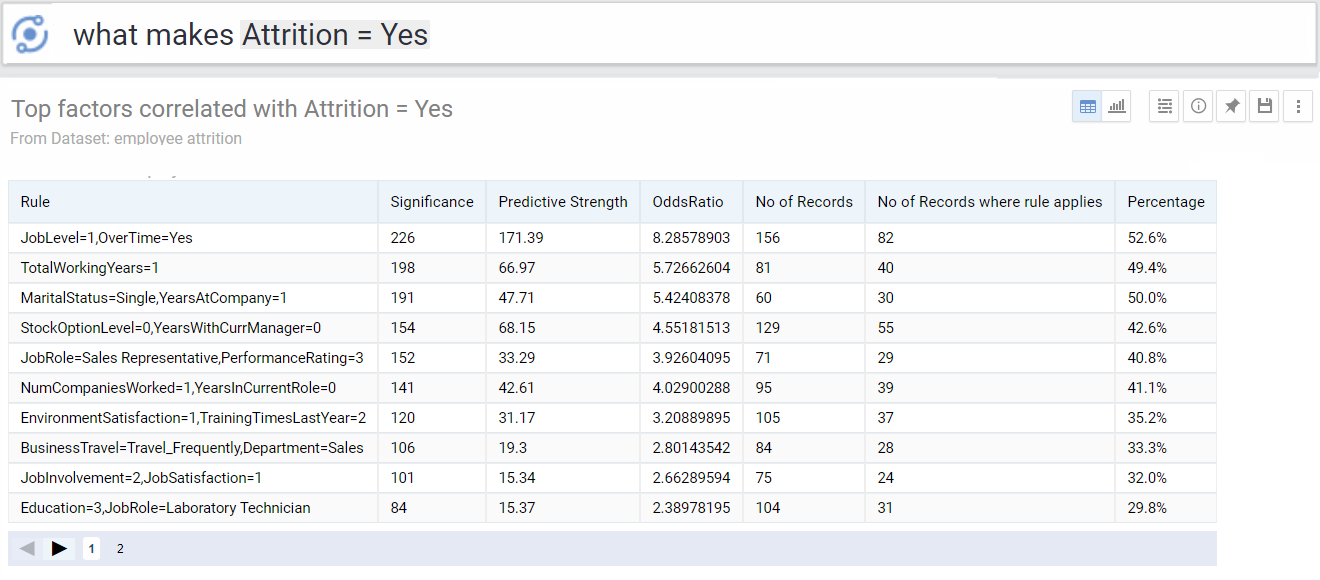
In the above table, AnswerDock listed all rules or cases that are statistically significantly correlated with having Attrition = true. Below if the explanation of the answer:
- Rule: The group of columns and their values that form a specific rule (or we can call it group, case or employee cohort). For example, the first rule groups together employees with job level = 1 and who work overtime.
- Significance: This is a score that reflects the significance of the rule. It is based on the actual occurrences of the rule in the data, compared with what would be normally expected based on probability calculations.
- Predictive Strength: This reflects the chi-square of the computed rule, which is a measure of the strength of correlation between the elements of the rule. Check the first point above for the definition of a rule.
- Odds Ratio: This is a statistical measure that determines the odds of your outcome condition (Attrition=Yes) in the case that your group or cohort condition (e.g. joblevel=1, Overtime=yes) devided by the odds of your outcome condition without having the presence of the group or cohort ( in this case, NOT having joblevel=1, Overtime=yes). if the Odds Ratio is higher than 1, then your outcome condition (Attrition=Yes is considered to be associated (not caused by) your group of cohort condition.
- No of Records: This is the number of records where the group criteria applies. For example the first row shows that there are 156 employees with job level = 1 who work overtime.
- No of Records where rule applied: This is the number of records where the group criteria applies and have the outcome condition (Attrition = true) . For example the first row shows that from the 156 employees with job level = 1 who work overtime, there are 82 who have left (Attrition = true)
- Percentage: The percentage of records for the specific group or cohort, who have the analyzed outcome condition (attrition = true). For example the first row shows that 52% of employees with job level = 1 who work overtime have left (Attrition = true).
Asking the Question in Multiple Variations
As in the case for other questions, you do not need to memorize a specific wording or sentence to ask about the correlation, AnswerDock’s NLP engine is able to understand the different variations of your question. For example, AnswerDock will also understand the below questions:
- What drives Attrition = True ?
- Whats making Attrition = True ?
- What are the factors correlated with Attrition = True ?
Asking About Any Outcome Condition
You can alternatively ask about other conditions, not necessarily of type: Field=Value. This is done using any advanced data filter. For example
- What makes Shipment status = Delayed or OnHold
- Whats driving AppRating above 4
In this case, AnswerDock will run a similar analysis to the one previously mentioned.
Asking About Factors Driving a Certain Column
You can also ask about drivers for a certain column, without specifying any outcome condition. For example:
-
- What drives Attrition?
- What factors correlate with Shipment Status?
In this case, AnswerDock will look for any combination of rules that apply for every value of the column. For example. “What Drives Attrition” will look for association rules for “Attrition = true” and “attrition = false”.
Asking About Association of Two Specific Conditions
You can also ask about whether a certain condition is associated with another. For example:
-
- Does PartTime=1 drive Attrition=True?
- Whats the relation between WeatherConditions=Rain and shipment status=Delayed?
In this case, AnswerDock will display a direct answer regarding the relationship between the above two specific conditions.
Applying Data Filtering Criteria
You can apply date filters, column value filters or advanced filters to the above question, same as any other search or question on AnswerDock. For example:
- What drives Attrition 2018?
- What drives Shipment Statuts to be delayed in California or texas 2017?
- What drives MorgageDefault=1 for male customers age < 40?
Limitations on analysis
At this stage, AnswerDock does not support comparison keywords with association rules analysis. The following questions are not supported:
- What drives Attrition 2018 vs 2017?
In order to do the above, you would need to run two separate analysis:
- What drives Attrition 2018?
- What drives Attrition 2017?