Summary: AnswerDock displays the optimal visualization according to the data returned by your question. You can also change the default visualization, switch to table view and export the results to a CSV or PNG file.
Displaying the Optimal Visualization
AnswerDock displays the answer to your question in the form of a chart. Based on your question, AnswerDock displays the optimal visualization that fits the columns returned.
For example a “Revenue by country” will display a Geographic Heatmap , as AnswerDock already knows (from the dataset’s fields settings) that the country is a Geo field, and so the map visualization would be the default.
A “Revenue by country monthly” question would show a stacked column with the x axis as the time, and the country displayed as different series. If there is space, the columns will be next to each other, if the chart is tight, AnswerDock will stack the series on top of each other. If that is also tight, AnswerDock will choose a line visualization instead. These are just a few examples of how AnswerDock’s algorithm works to optimize the visualization selected for the answer.
Changing the Default Visualization
This documentation has a dedicated section on working with charts, containing the details of changing a visualization, customizing the charts, as well as an explanation for each type of chart available.
Auto generated Title and Subtitle
AnswerDock auto generates the answer title based on the question asked. The title provides information about the fields (metrics and/or dimensions) used and the aggregations performed. The subtitle displays any filters applied to the data, any limitations in the rows returned and the dataset from which the data was extracted.
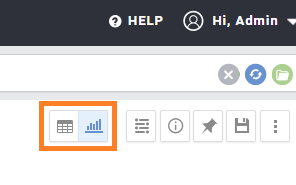
Table and Chart View Toggle
You can switch the display of the results between a chart visualization and a normal table by using the Table/ Chart toggle.
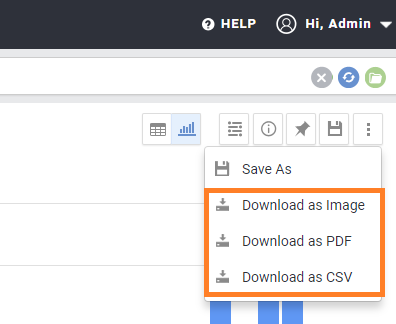
Downloading the Chart as PNG, PDF or CSV
You can download the Chart Data in CSV format from the three dot menu on the top right of the answer area. You can also download the chart as PNG or PDF from the same menu