Summary: Tables show the row data returned to answer the question.
You can always switch your view to a table by using the Chart/Table view toggle on the top of the chart. The table view shows the data as it is returned from the answer to your question. You can sort any column by clicking on the header.
Un-Pivoting the Returned Data
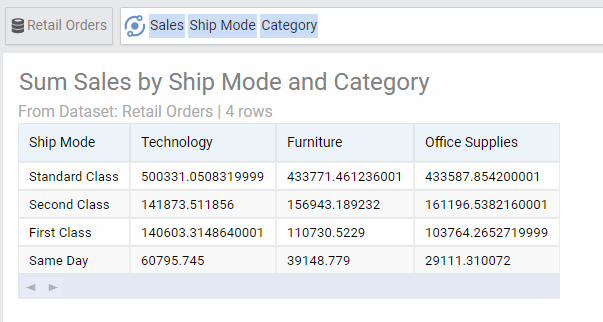
Note that in some cases, AnswerDock returns data in a pivoted format. This means that the columns of the data can be in some cases, representing different segments of a dimension, instead of representing fields from your dataset. For example, in the chart above, the table view shows data pivoted by Ship Mode vertically and Category horizontally. If you need the data to be in list format without pivoting, you need to type List or Table in your question. This will generate the below unpivoted view:
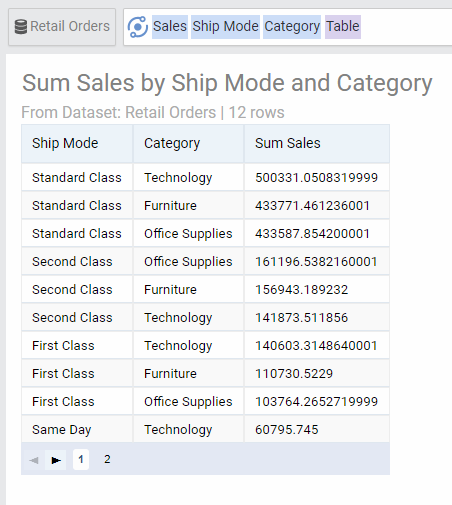
Table options
| Option | Explanation |
|---|---|
| Numbers Format | Change the format of the numbers used in the cells of the table |
| Rows Per Page | Number of Table Rows for each page. This is set to 10 by default. |
| Limit Table Rows | The limit set for the number of rows in the table. This is set to 2500 by default. |
| Display Row Number | This will add a sequence number to each row in the table. |
| Freeze First Column | This will freeze the location of the first column when scrolling horizantally. |