Summary: Use Geo Markers, Geo Bubbles or Geo Heatmap charts to visualize data on a map.
Geo charts show values of metrics on a map using a dimension field that contains geographic location information
Types of Geo Information
Below is a list of all Geo information that can be used in Geo Charts
| Street Address | This is any text field containing a street address. The Geo Chart library will try to get the location from the information of this field |
| Country Code (3 letters) | 3-letter codes for countries: USA,BRA,CAN,MEX,JAP,etc.. |
| Country Code (2 letters) | 2-letter codes for countries: US,BR,CN,MX,JP,etc.. |
| Country Name | The full name of the country. |
| Continent Code or Continent Name | The code or full name of the continent as follows: AF-Africa,NA-North America,OC-Oceania, AN-Antarctica, AS-Asia, EU-Europe, SA-South America. |
| City Name | The name of any city in the world. The Geo Chart library will try to get the location from the information of this field. Its better to have the country along with the city to ensure proper location mapping. |
| GPS longitude and Latitude | This is the Geo location in the form of Longtitude + comma + latitude. Such as 25.400213,55.479274. If your data have the information in two separate fields, you can create a custom field and concatenate both separated by a comma. |
| State code | NY,LA,etc. |
| State name | Full name of the state such as New York, Los Angelos, etc.. |
| Zip Code | Zip code in the format 90201 |
There are many other types supported such as Metro Code, Metro Name, Region Code, Region Name, Sub Continent Code and Sub Continent Name
Geo charts Types
Geo Marker Chart
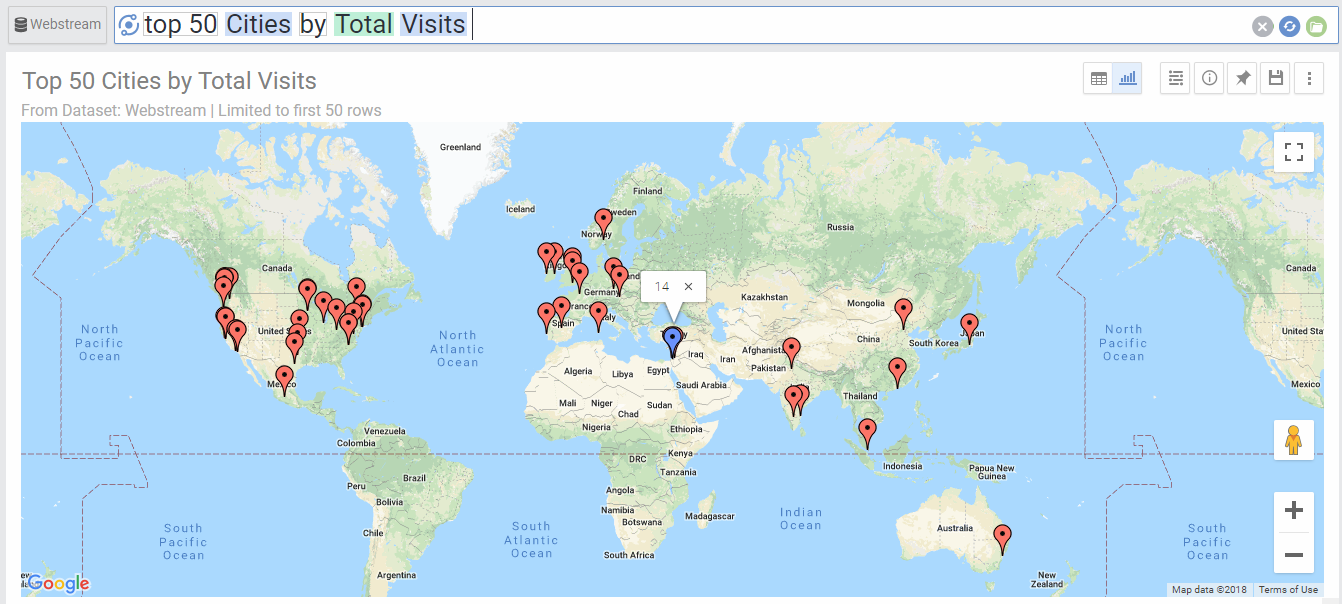
Geo marker charts show pins on a google map according to the values of a Geo column. You need at least one Geo dimension field to plot a Geo Markers chart. Typically Geo markers are used when the Geo column represents a specific address such as Geo coordinates or street address. AnswerDock automatically takes any address information you have in the Geo field and tries to pinpoint it on a the map.
In the example below, Each city will be pinpointed on the world map, and the caption for each will contain the number of visits. Note that since the geo information does not have the GPS coordinates, AnswerDock will take some time fetching the location of each city on the map. Geo Markers will generally work faster if the location field had GPS coordinates.
Geo Markers Options
| Option | Explanation |
|---|---|
| Location | The Geo dimension used for the location on the map. |
| Label | The Metrics or the dimensions used for the label of each pin. |
| Color | The Metric used for the color of each pin. |
| Zoom In | This allows you to zoom into a specific country or region |
| Numbers Format | Change the format of the numbers used in the data labels and on-hover data call-outs of the chart. |
Geo Bubble Chart
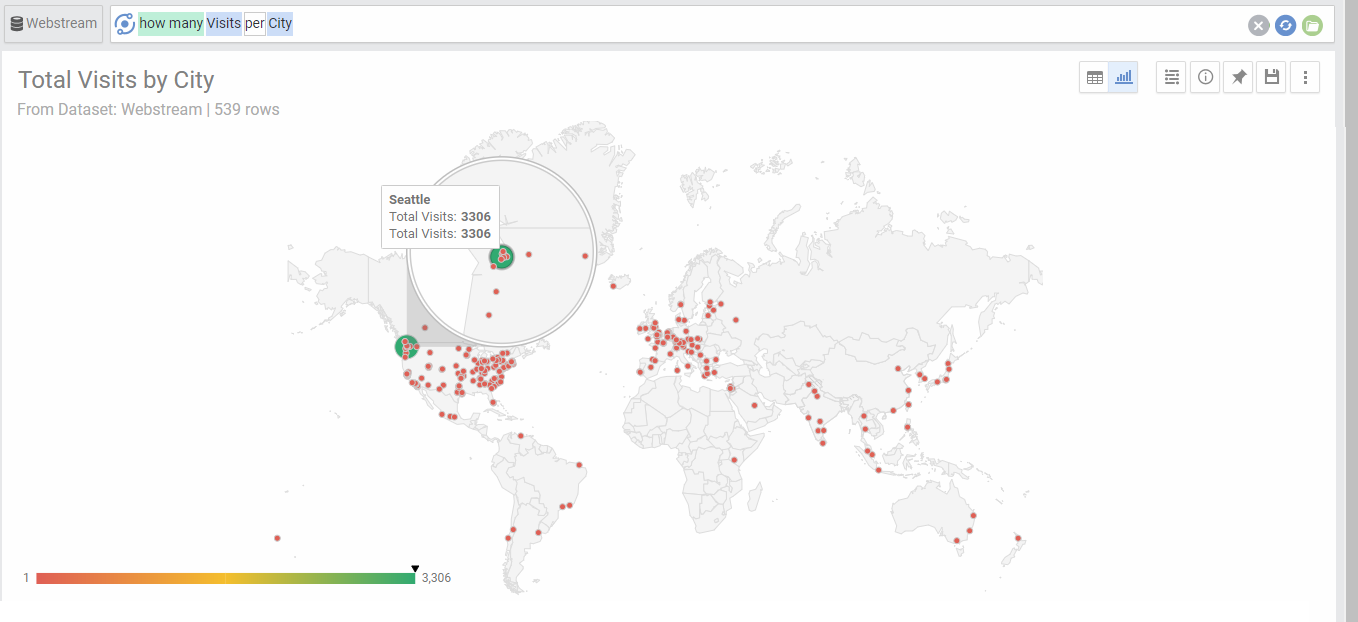
Geo bubble charts allows to draw bubbles on a map, where bubble size and color can represent two metric values, while the bubble location is according to a Geo dimension. Below Example uses visits metric to represent both size and color, and the city dimension to represent the location
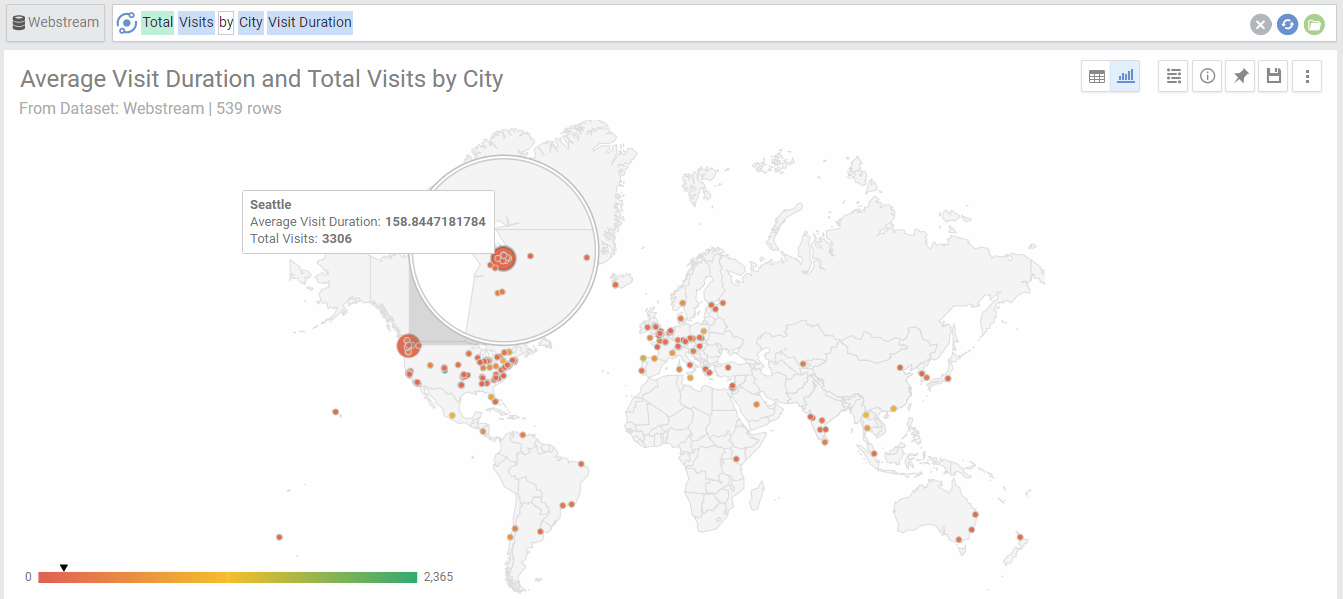
If you add another metric (e.g. Average Visit Duration), then the visits will be represented by size of bubble and the Average Visit Duration will be represented by a color scale:
Geo Bubble Chart Options
| Option | Explanation |
|---|---|
| Location | The Geo dimension used for the location on the map. |
| Size | The Metric used for the size of each Bubble |
| Color | The Metric used for the color intensity for each bubble on the map. |
| Zoom In | This allows you to zoom into a specific country or region |
| Numbers Format | Change the format of the numbers used in the data labels and on-hover data call-outs of the chart. |
Geo Heatmap Chart
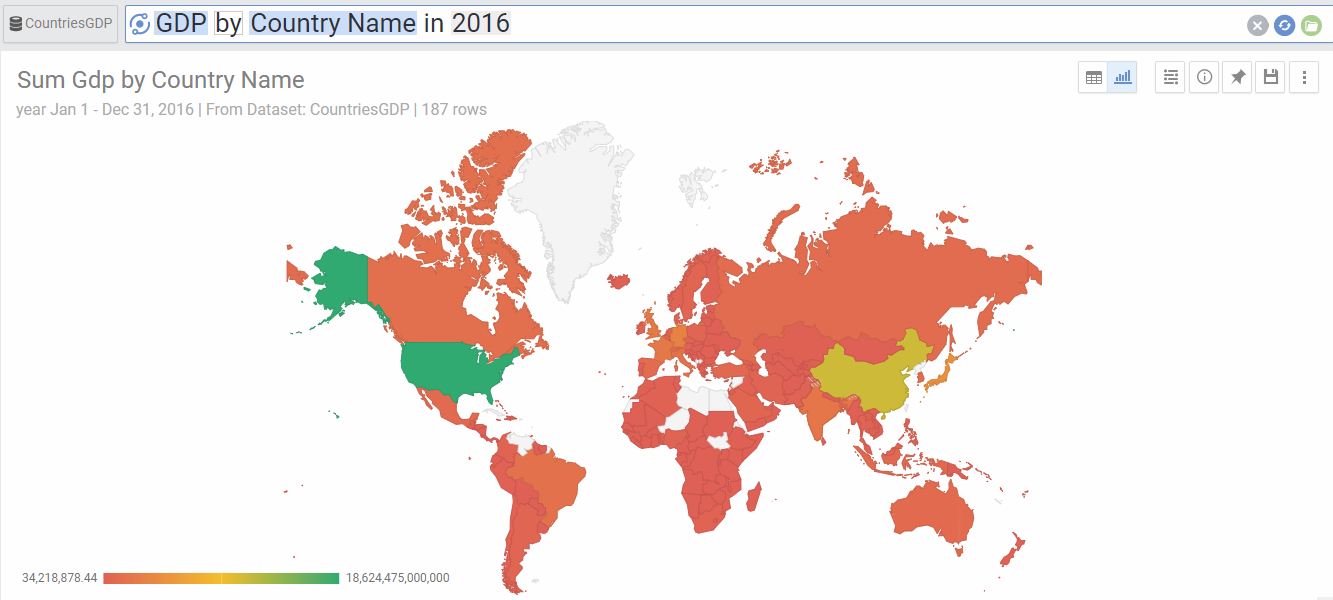
Geo Heatmap charts show values of a metric on a map using a Color scale. You need to have one metric field and one Geo dimension of type Country to use this type of chart.
Geo Heatmap Chart Options
| Option | Explanation |
|---|---|
| Location | The Geo dimension used for the location on the map. |
| Color | The Metric used for the color intensity for each country on the map. |