Treemap charts use area sizes and colors to represent up to two metric values. The areas are divided by segments belonging to a dimension. You can also have multiple sub-dimensions to show once one of the areas representing the parent dimension is clicked. This allows to show a large amount of data in a hierarchical manner. To use treemap charts, you need at least one metric and one dimensions.
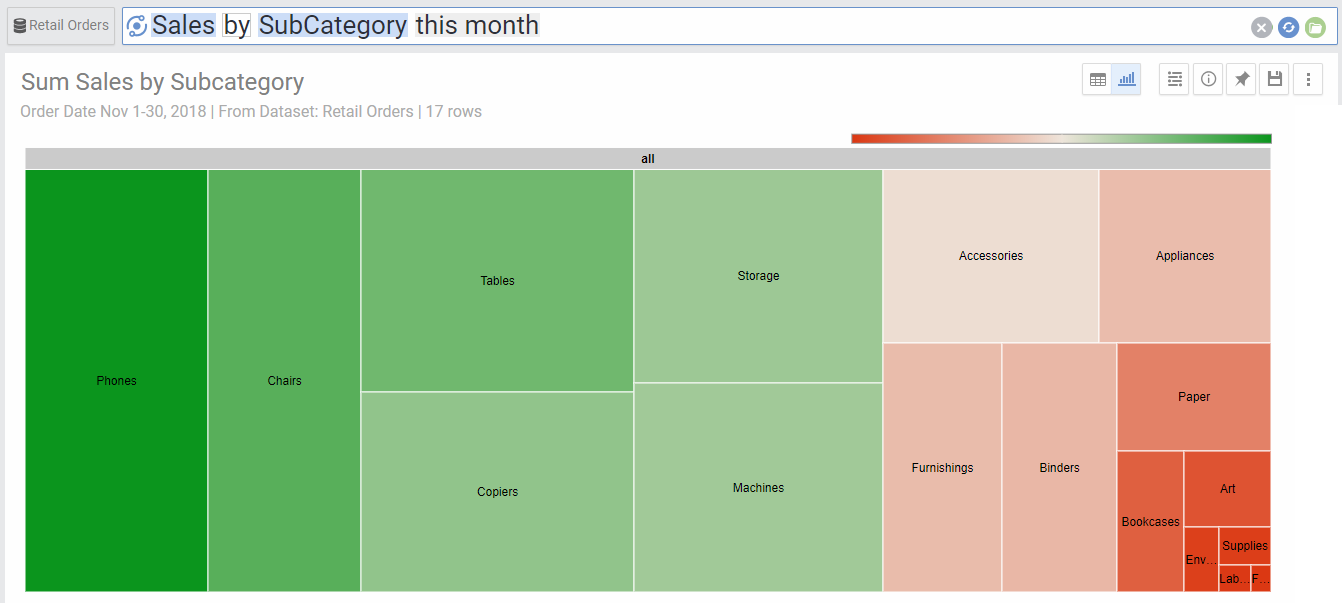
In the case of one metric and one dimension, the size and color are both used to represent the value of the metric. In the below chart, both size and color are used to represent the Sales metric
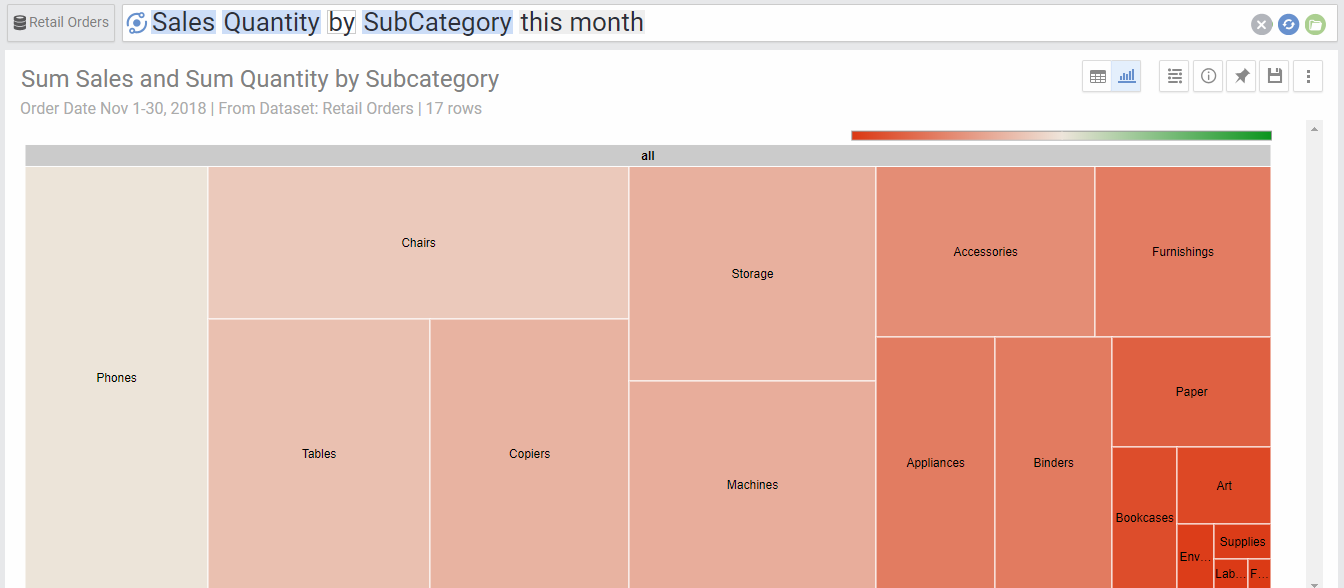
In case of two metrics below, the sales is represented by size and quantity is represented by color:
If we had two dimensions, AnswerDock would represent them in a hierarchy, where clicking on the parent segment opens another Treemap for the branch. To go back to the parent, you can right click on the chart. Below is an example hierarchy from category down to subcategory.
Chart Options
| Option | Explanation |
|---|---|
| Category | The Dimensions used categorizing the data in a hierarchy |
| Color | The Metric used for the color of the rectangles |
| Size | The Metric used for the size of the rectangles |
| Color | The Dimension used to segment the bubbles by color. |
| Switch Categories | If you have a hierarchy of two nested categories, it will switch the order between the two. |
| Numbers Format | Change the format of the numbers used in the Axes and on-hover data call-outs of the chart. |