Summary: Calendar charts use color variations to show daily changes for a certain metric.
Calendar charts show the value of a metric on a calendar. You need to have one metric and one date (daily) dimension. The value of the metric will be represented by a color scale. These type of charts are useful when you want to visualize how a metric changes on day to day over a long period of time.
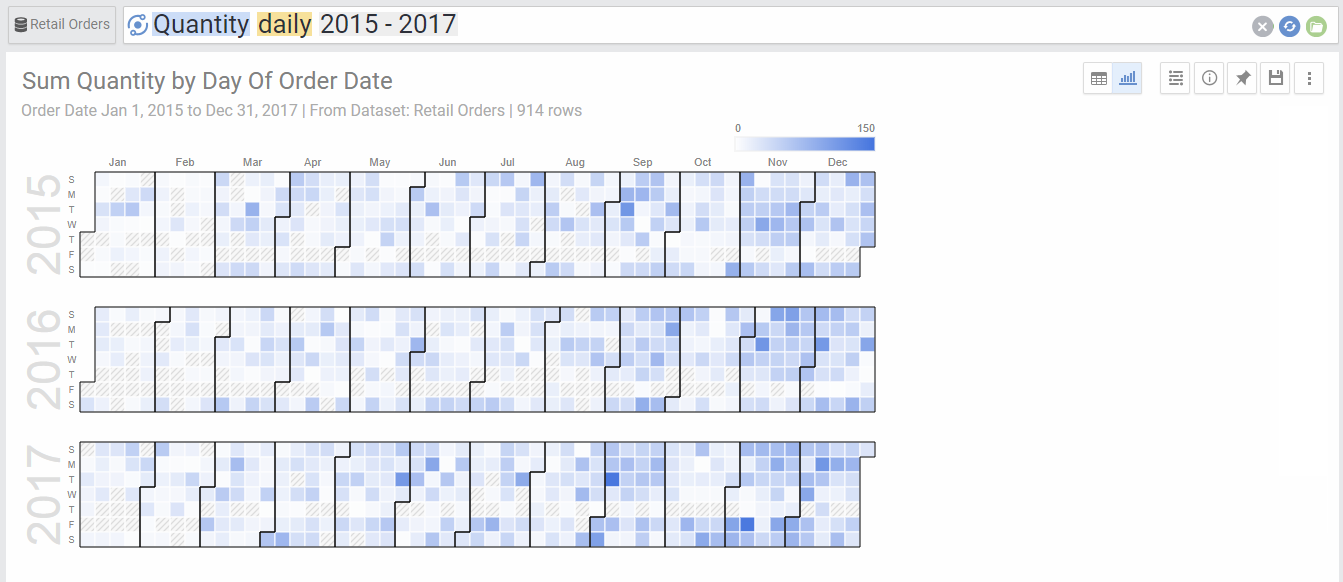
Chart Options
| Option | Explanation |
|---|---|
| Cell Size | Select the size of the cell representing each day in the calendar |