Summary: You can calculate the percentage of a specific segment using the “Share” or “Percentage” keyword. Adding a time interval keyword (e.g. monthly) will calculate the share over time.
https://youtu.be/z3uFuZW-9H0
Calculating Percentages of all values within a dimension
To show the answer to a question in percentage terms, you simply add a percentage keyword to your answer. For example a question like
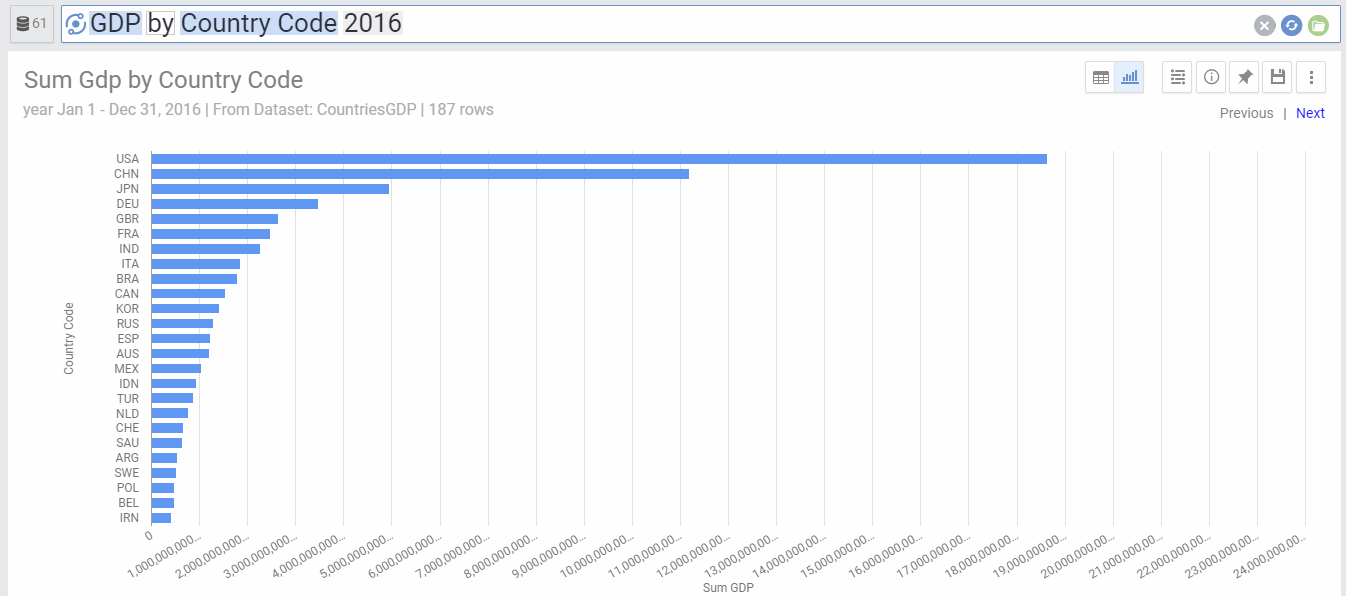
- GDP by country code 2016
will default to a bar chart showing GDP for every value in the country column.
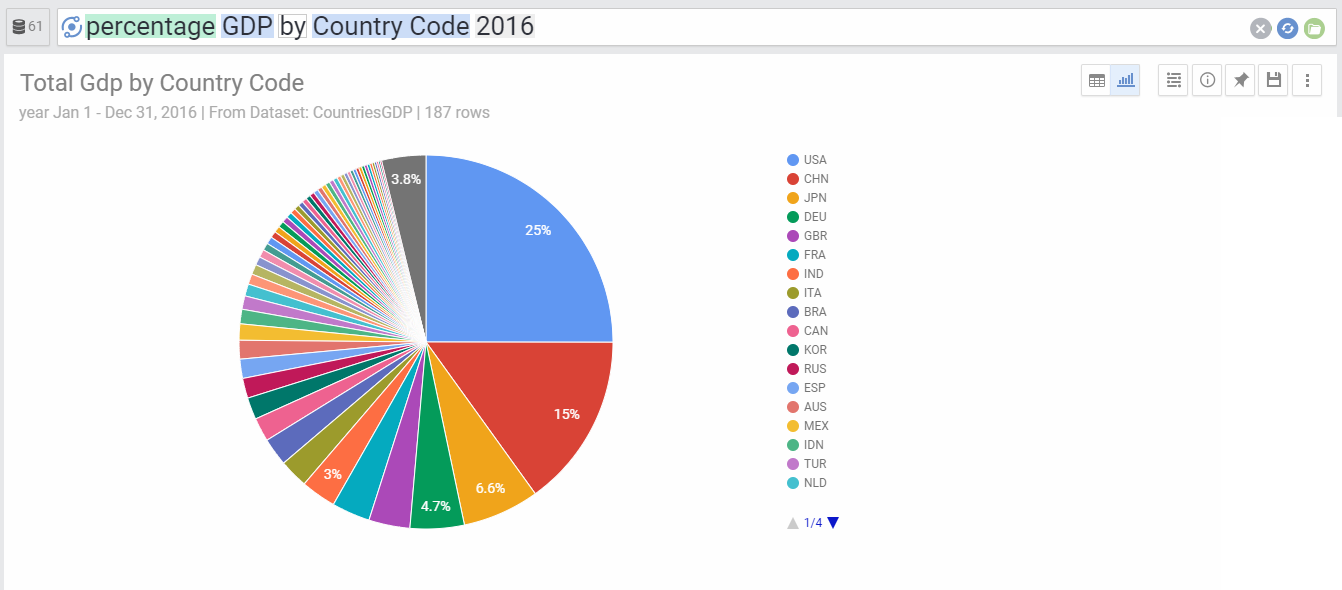
When Adding the word percentage as below:
- Percentage GDP by country code 2016
The answer will show a pie chart with percentage of revenue for each country.
Alternatively, we could have just add the chart type “Pie” to the question:
- GDP by country code 2016 Pie
We could have also just selected the Pie chart from the chart selection menu.
As in the case for other keywords, AnswerDock understands other similar keywords such as percent, share, breakdown, etc..
Calculating Percentages of a specific value within a dimension
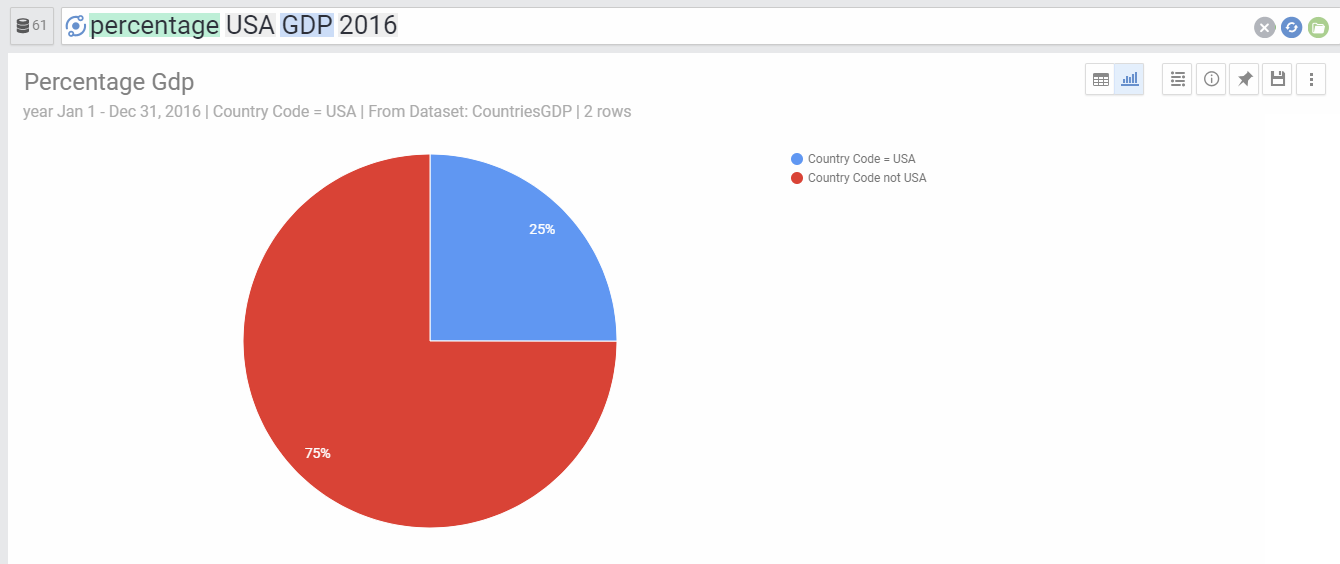
In our previous example, we can calculate the percentage of GDP for a specific country (e.g. USA) to the total GDP:
- Percentage USA GDP 2016
This will also show a pie chart, but will highlight USA as one segment and all the others in a different segment.
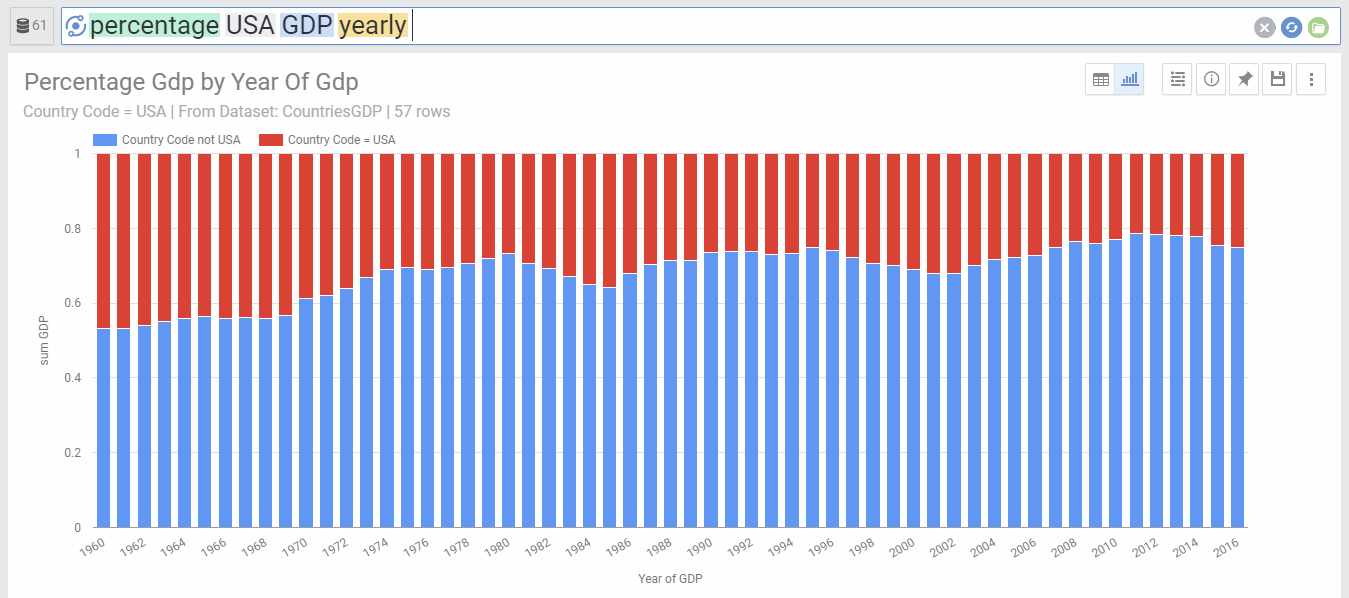
You can also combine the percentage keyword with a time interval keyword to show the percentage over time. For example:
- Percentage USA GDP Yearly
This will show the share of USA GDP for each year:
Here is another example showing how the answer adopts to your typed question.
Calculating Percentages of a specific segment using a data filter
Percentages can also be calculated for any data filter, not only for a specific value within a column. For example, you can type:
- Percentage of sales ProductName containing Samsung or Apple
This will show a pie chart highlighting the percentage of sales for products containing the word Samsung or Apple. Similarly you can add an interval keyword to see the trend over time.
- Monthly Percentage of sales ProductName containing Samsung or Apple
Calculating Percentages for count of records for a specific segment
Percentages can be calculated for the count of records, not only for a specific metric, for example:
- Monthly Percentage of orders in electronics
will return the monthly share of orders in electronics category. Note that Orders is not a metric, its the record name we set for the dataset in the dataset settings.