Summary: Dashboard filters are used to limit the data returned to all the charts included in the dashboard, to allow you to analyze performance of a specific segment.
Dashboard filters enable users to filter the data across the whole dashboard. For example,in a monthly performance dashboard, you might want to see the same charts, but for a specific team, country or segment rather than the whole data. This can be done using dashboard filters.
Adding a Dashboard Filter
To add a filter, do the following:
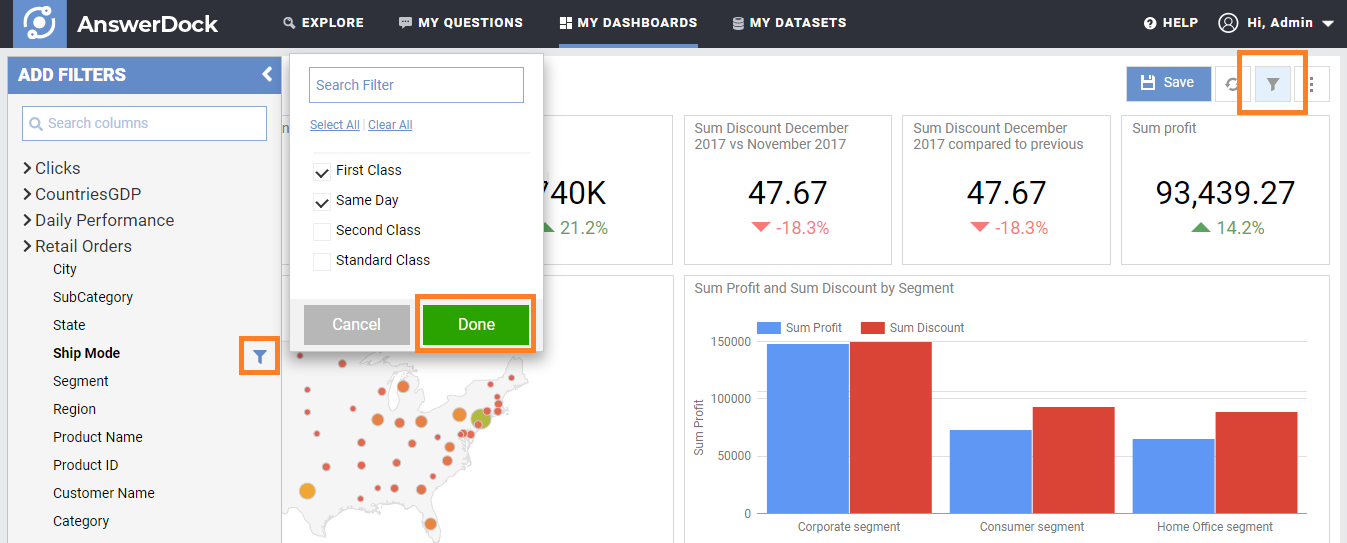
1- Click on the filter icon on the top right corner of the dashboard page. This will show a side menu with all datasets that are used to populate the dashboard. Under each dataset, you will have a list of columns (dimensions) where you can apply your filters.
2- Click on the filter icon that shows next to each column
3- Select the values you would like to filter on.
4- Click Done. The dashboard will refresh and show the charts with the data filters applied.
Editing a Dashboard Filter
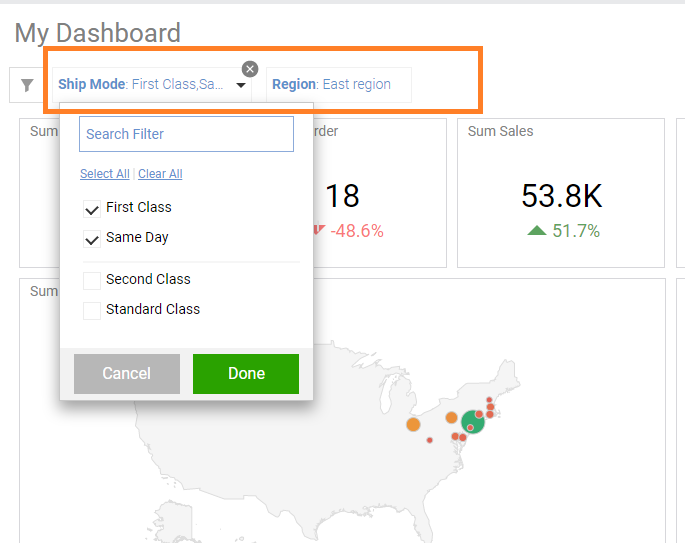
Applied filters will show under the title of the dashboard, and you can easily click on any filter to edit its values. You can also click on the remove (x) icon to remove the filter.
Saving a Dashboard Filter
To save the applied filters, click save on the top right of the dashboard page. When the dashboard is opened again, the filters saved will be applied by default.