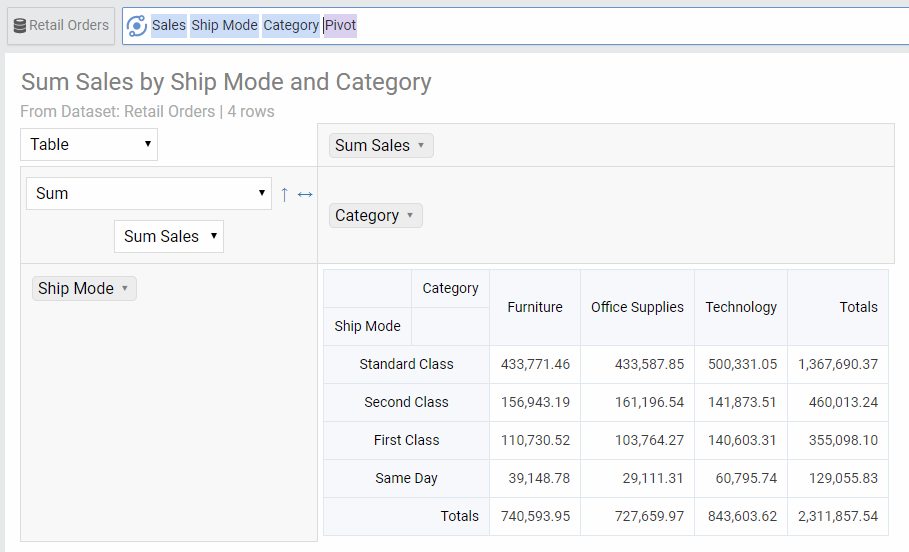
Summary: Pivot tables are popular as they let users see their data in different views through a simple drag and drop interface.
AnswerDock allows you to explore your data through a pivot table. In this type of visualization, you can have as many metrics and dimensions as you require, returned by your question. In the Pivot Table interface, you can easily drag and drop the fields across either columns or rows. The pivot table also has some aggregation functions that you can select to apply on your data.
Pivot table options
| Option | Explanation |
|---|---|
| Numbers Format | Change the format of the numbers used in the cells of the table |