Summary: Use moving window or trailing aggregate functions to compute aggregates for a range of periods forming a “window” before and after each value in the dimension or X-axis.
https://youtu.be/l30hn8YMqAU
Moving Window Aggregates allows you run an aggregation function (e.g. sum, average,min,max) and apply it to a range of values of the dimension. the range of values is defined by the start and end of the window interval. AnswerDock supports the following moving window aggregate functions:
- Moving n1 to n2 window Sum:Returns the sum of the metric, for each value starting with the X axis value minus n1 and ending with X axis value plus n2. Other functions such as Moving Average, Moving Count, Moving Min, Moving Max work the same way as Moving sum. Example of this is “Moving 1 to 1 window sum”.
- Trailing n period sum:A trailing aggregate is a special case of a moving aggregate. A trailing n period sum has a window starting with -(n-1) and ending at the current value. For example a trailing 12 month average will compute the average of the last 12 months including the current month. it is the equivalent of Moving 11 to 0 window average. An example of this is “Trailing 12 period sum”.
- Trailing n days/weeks/quarters/months/years. This is another way of typing a trailing window aggregate. An example of this is “Trailing 12 months”. A special keyword for Trailing 12 months is TTM.
How to use Moving averages
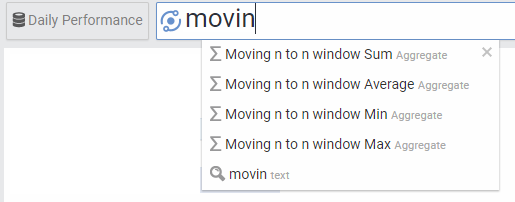
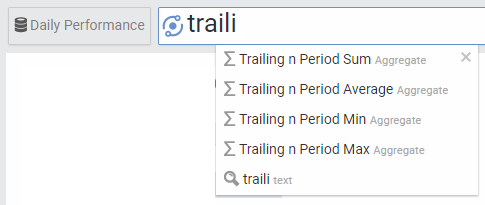
To use a moving average, either type “moving” or “trailing” in your search box and select the required expression from the list:
The values will default to Moving 1 to 1 window aggregates (a window of three periods), and for trailing it will default to the last 12 periods. To change the default you can just overwrite them. You need to also include an interval keyword (e.g. monthly) with the moving aggregates. If you do not, AnswerDock will default to a monthly interval.
Examples
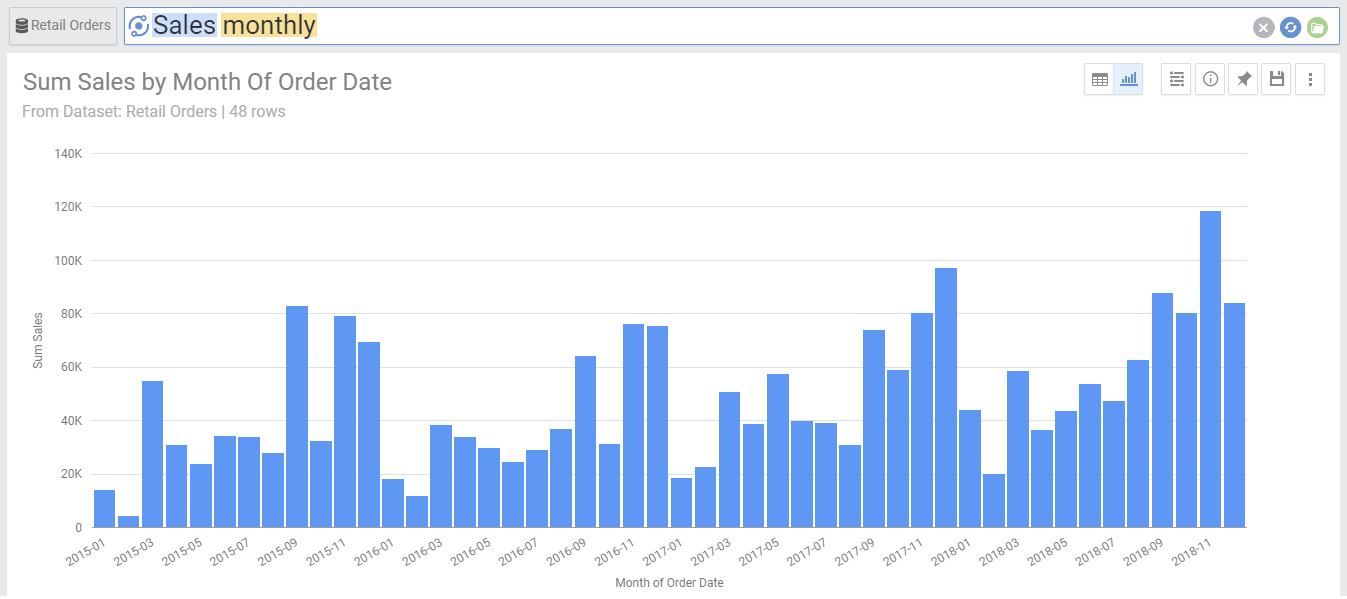
Lets say you have a graph showing the sum of sales for each month. For this you would simply type:
- Sales Monthly
If you would like to see trailing 12 month, meaning to show at every month the total historic sales in the last 12 months (previous 11 months + current month) , you would in this case type any of the below
- Sales Monthly trailing 12 period sum
- Sales Trailing 12 months
- Sales TTM
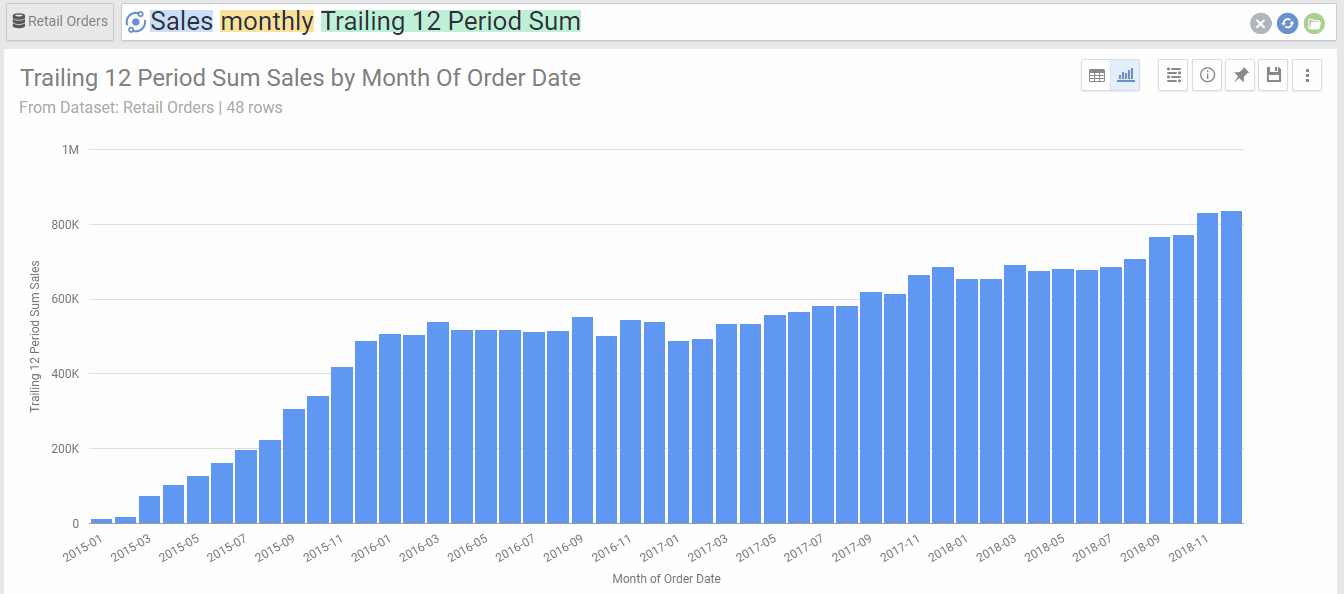
- Sales Monthly moving 1 to 1 window average
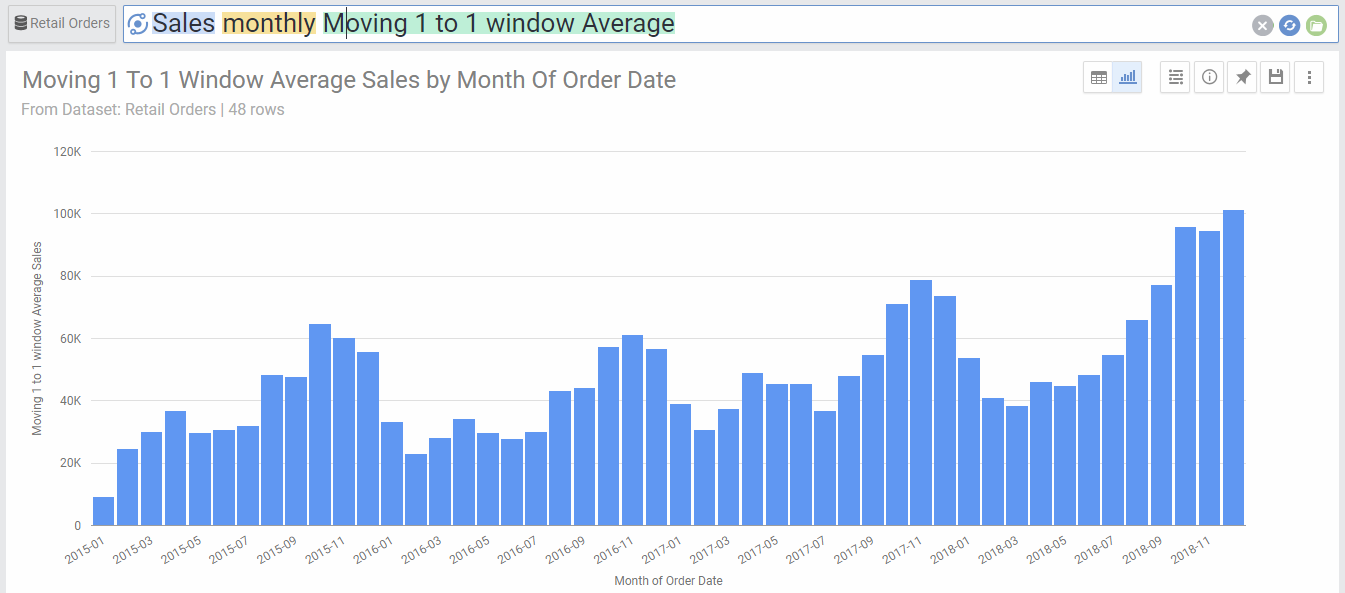
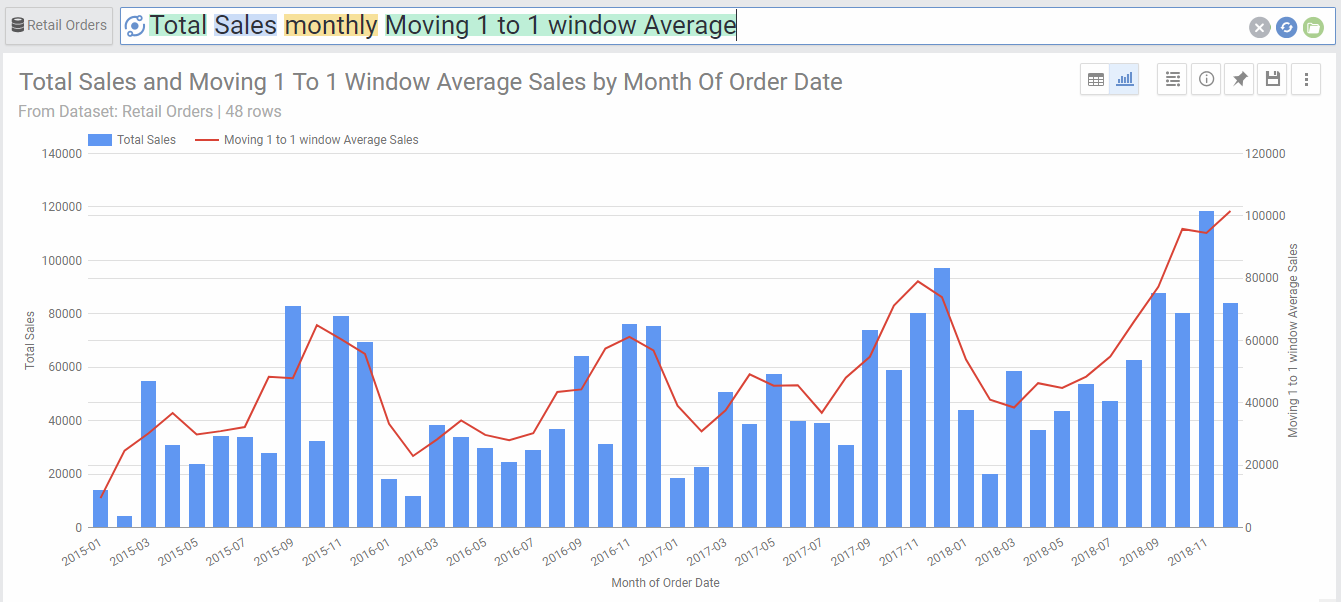
To draw the moving average alongside sales, we can just type total next to sales:
- Total Sales Monthly moving 1 to 1 window average
This way, our question include two aggregates, and they will be represented with twe lines in the chart, or in case of a line with chart column, it would be one line and one column:
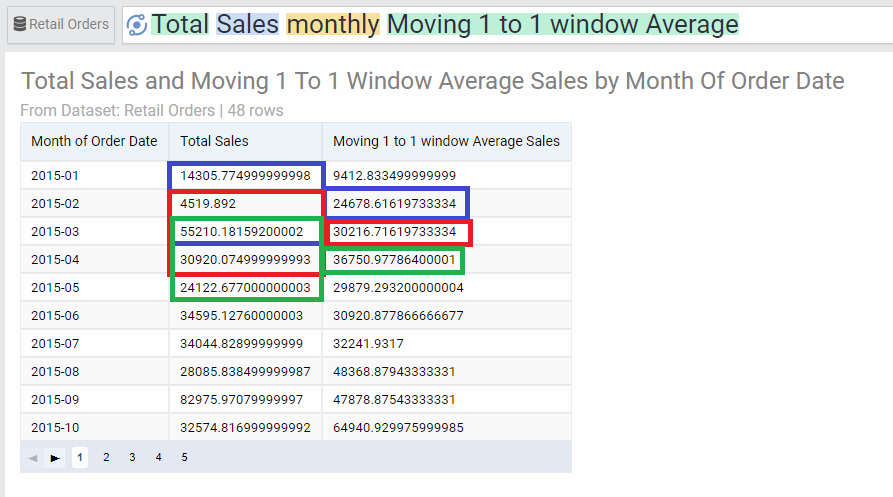
to see the calculations behind the window average, click the chart/table toggle to switch to table view. The table clearly shows how the calculations were done. Every three months sales were averaged as shown. Each box represents a “window” of three months.
Moving aggregates with multiple dimensions
Currently, AnswerDock supports up to two dimensions (date + 1 additional dimension) with the moving window aggregates. For example, the following search return then moving window sum of sales for each country.
- Sales Monthly by country moving 1 to 1 window sum