Summary: Use comparison keyword “VS” to easily compare between two different dates, column values or data filters.
https://youtu.be/w3O3Jol6jwA
Comparing between segments is done using the “Vs” keyword or any of its synonyms (versus, compared to). The comparison allows to quickly show data of two different segments together on a chart. The comparison can be in one of three different types: Date, column values or data filters comparisons.
Date Comparison
This allows you to compare between two different time periods. To do this you just type date1 vs date2. Below are a few Examples:
| Revenue this year vs last year | This will show current year revenue vs the whole last year revenue on a score card or a side by side column chart |
| Revenue Year to date vs last year | This is the same as the previous example, however it will compare the year to date revenue with the equivalent period in the previous year (not the whole last year). |
| Patients Q1 compared to Q2 this year | Will compare Q1 and Q2 this year. |
| Patients Q1 vs Q2 vs Q3 this year per region | Will compare Q1 and Q2 this year, for each region. |
| Payments daily march vs feb this year | Will compare each day in march vs feb |
| Average ratings this month vs previous year | Will compare this month with the same month last year |

Note that you can also compare between multiple date segments (not only two). Note also that date comparison does not currently support overlapping date segments. The following search for example will not work
- Growth in sales last month vs last 6 months
Comparison Between Two Column Values
This allows you to compare between two different values for a certain column. To do this you just type value1 vs value2. Below are a few examples
- Growth in sales for electronics vs fashion
- GDP of US vs CN
- average temperature for state = NY vs NJ
Comparison Between Two Data Filters
This allows you to compare between any two data filters. To do this you just type filter1 vs filter2. Below are a few examples:
- Searches for keywords containing apple vs keywords starting with Samsung
- Average profit for visits with rating>4 compared to rating<=3
Comparison Between a Number of Segments and the Total
You can use the Vs All expression to compare the value of a metric for a specific segment(s) to the total:
- Searches for keywords containing apple vs keywords starting with Samsung vs All
- Average profit for visits with rating>4 compared to rating<=3 vs All
- Revenue for US vs Canada Vs All
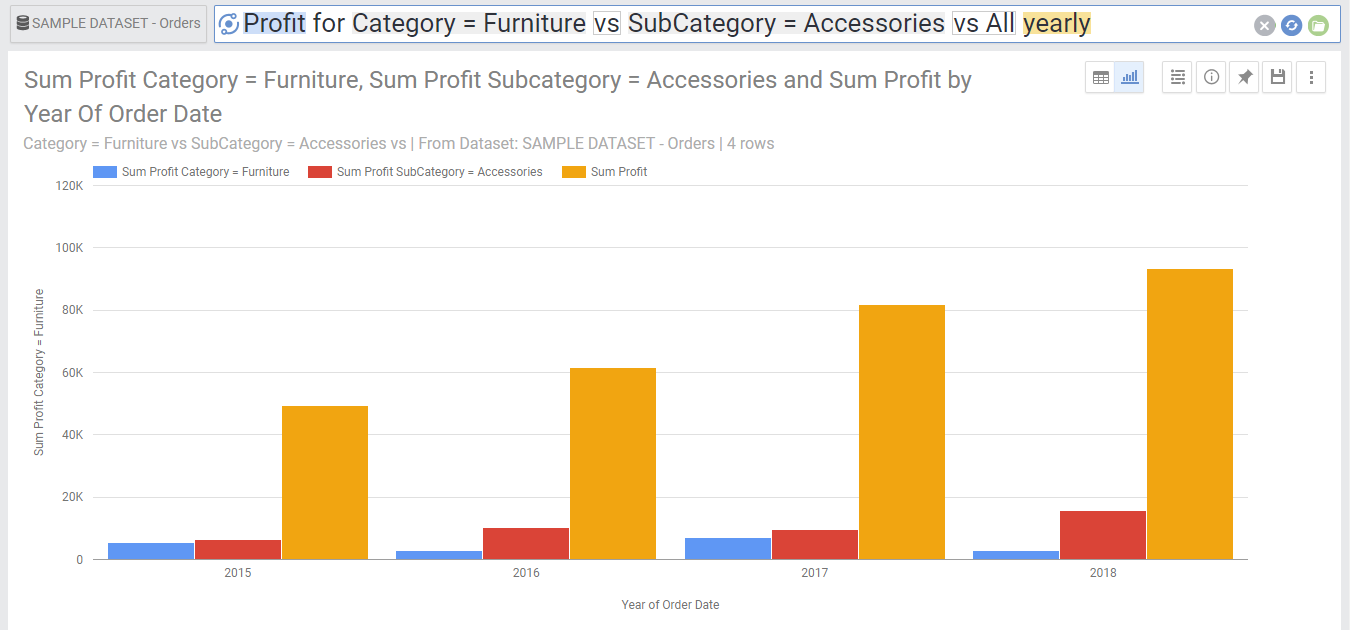
- Profit for Category = Furniture vs SubCategory = Accessories vs All yearly
Below shows the graph generated by the last example.
Comparison Between a Segments and all the other segments
You can use the Vs other expression to compare the value of a metric for a specific segment(s) to all the other segments:
- Searches for keywords containing apple vs Other
- Average profit for visits with rating>4 vs Other
- Revenue for US Vs other
- Profit for Category = Furniture vs Other yearly