Summary: Use cumulative functions to compute aggregates cumulatively for each value in the dimension or X-axis.
Cumulative Aggregates allows you run an aggregation function (e.g. sum, average) and apply it on each value of the dimension, cumulatively. AnswerDock supports the following cumulative aggregate functions:
- Cumulative Sum:Returns the sum of the metric, accumulated by the dimension in your question
- Cumulative Average: Returns the Average of the metric, accumulated by the dimension in your question
- Cumulative Count: Returns the count of records, accumulated by the dimension in your question
- Cumulative Min:Returns the minimum value of the metric, accumulated by the dimension in your question
- Cumulative Max:Returns the maximum value of the metric, accumulated by the dimension in your question
Note that as with the case for other keywords, AnswerDock will understand synonyms to the above functions, such as Cumulative total, Cumulative Avg, Cumulative Minimum, etc..
Examples
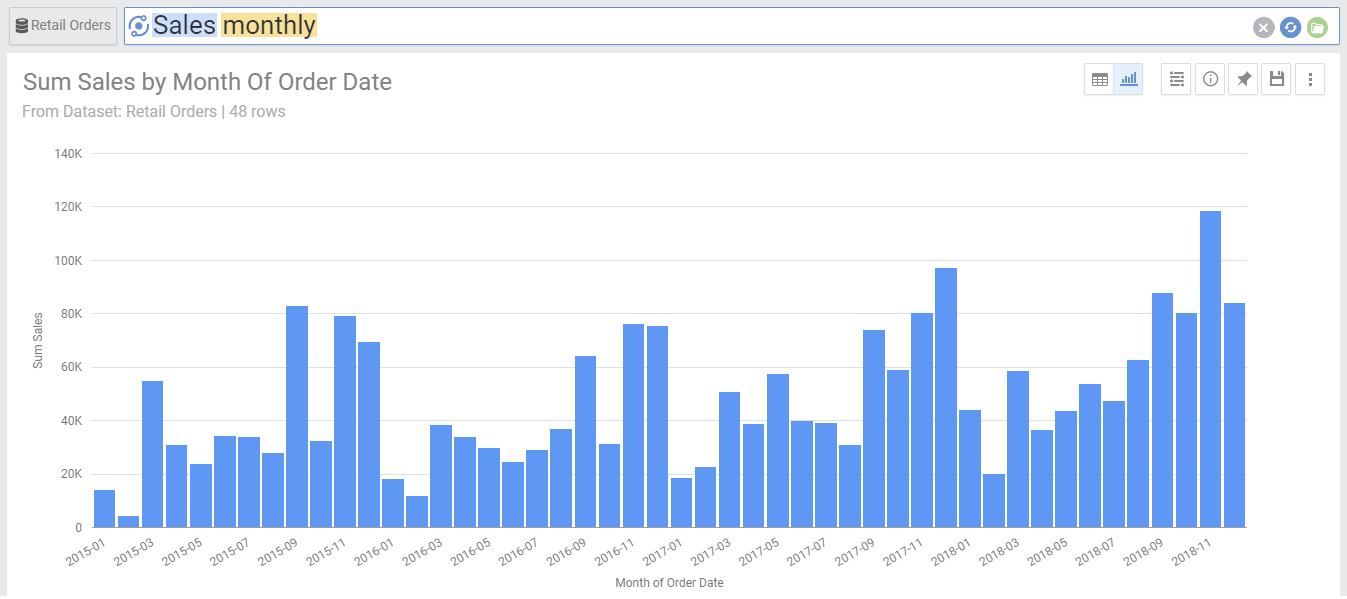
Lets say you have a graph showing the sum of sales for each month. For this you would simply type:
- Sales Monthly
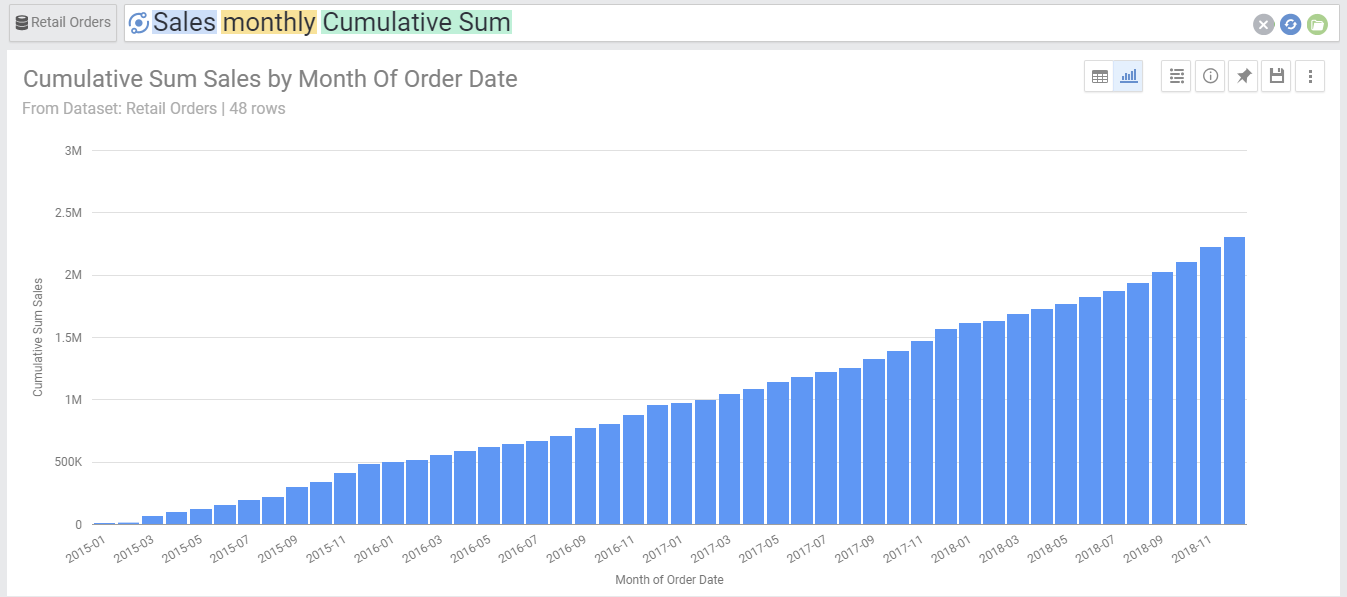
If you would like to see how sales stack up every month, meaning to show at every month the total historic sales in addition to the current month, you would in this case type:
- Sales Monthly cumulative sum
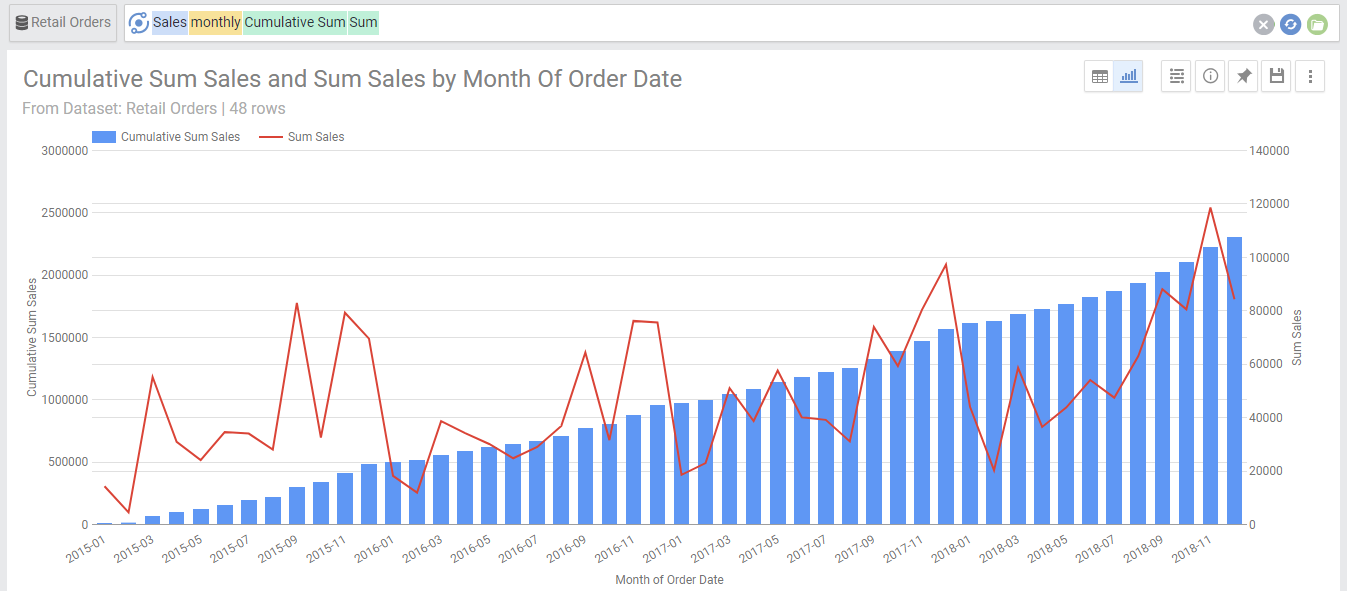
You can see both the sum and accumulative sum , by adding another Sum aggregate:
- Sales Monthly cumulative sum sum
Note that in the above graph AnswerDock detected that both metrics have different values, so in order to optimize the visualization, it applied a dual y axis. This is a setting that you can turn off from the chart settings menu for the Line With Column graph.
Cumulative Aggregates with multiple dimensions
AnswerDock supports multiple dimensions with the cumulative aggregate. For example, the following search will return the monthly cumulative sum of sales for each country
- Sales Monthly by country cumulative sum


