Search Driven Analytics: AnswerDock Vs Tableau Vs PowerBi
Using the same dataset, we tested the search driven analytics and Natural Language Processing capabilities of Tableau, PowerBi and AnswerDock and compared performance in terms of
1- Ease of Use
2- Charts Available and their relevance to the query (which product produces best chart for the given question)
3- breadth of keywords and calculations that can be done.
Using the same dataset, we tested the search driven analytics and Natural Language Processing capabilities of Tableau, PowerBi and AnswerDock and compared performance in terms of :
1- Ease of Use
2- Charts Available and their relevance to the query (which product produces best chart for the given question)
3- breadth of keywords and calculations that can be done.
The video shows the difference between products which include search driven analytics as a side, nice to have feature vs products that are entirely built around search.
Tableau caused a lot of frustration to our testers, even with the simplest forms of search such as looking up a year or an attribute value. It always forces the first value of the drop down feature upon hitting enter which in most cases did not match what the user intended to search for. Moreover, it laacks many important keywords such as growth, comparisons (vs), ability to filter date by typing a filter statement, etc.. At this point, its simply just a nice to have feature that will work less than 50% of the time and users will deem very limited.
Next is PowerBi: It worked better in terms of keywords that Tablea, however still lacked most of the important keywords (growth, Comparisons). More importantly, the graphs generated by powerbi to answer the questions are imply not readable and not optimized to best fit the answer. While performing better than Tableau, it is still just a side feature that probably most users just try for a couple of questions, then move to building charts in the typical manner
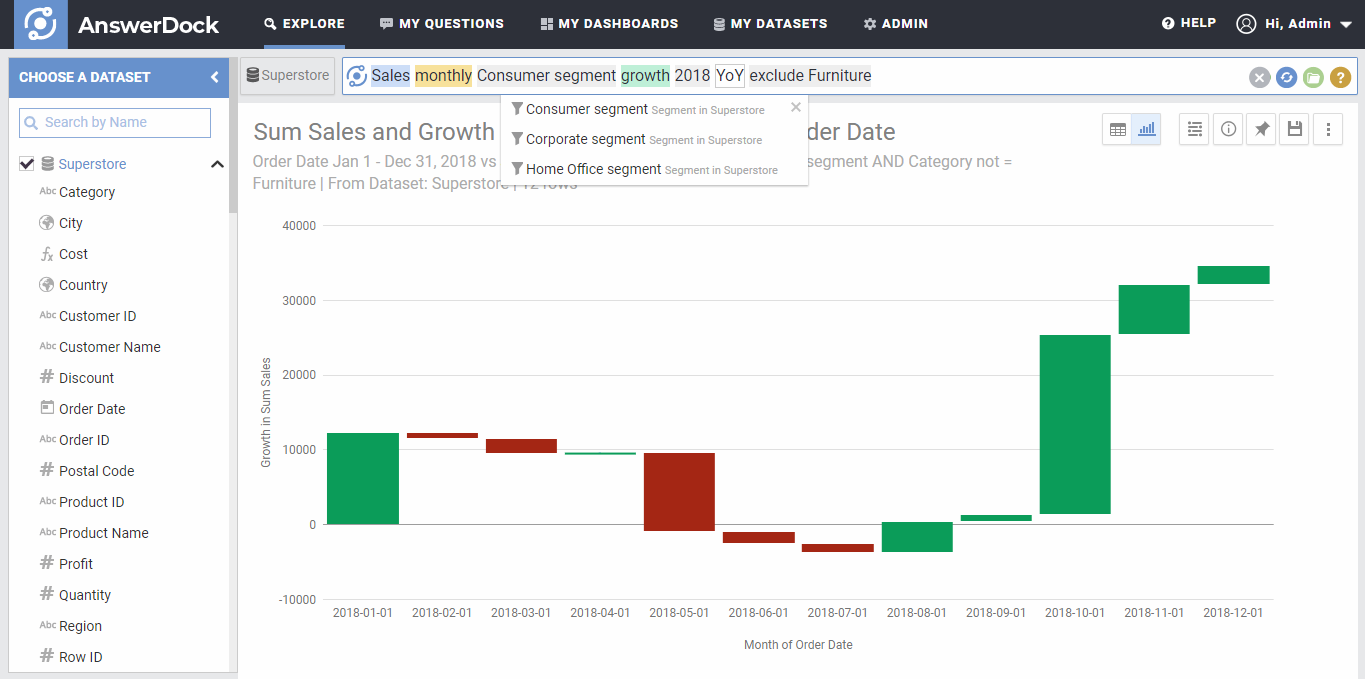
Lastly, we show how AnswerDock is entirely built around search. User can look up values easily using the search guidance menu or just hit enter and AnswerDock will instantly generate the answer. Note that AnswerDock supports hundreds of keywords and understands words in natural language, and does not require a speccific way of writing the questions. It supports numerous calculations such as growth, comparisons of dates, segements as well as questions that require data mining to answer (e.g. why did sales go up yesterday).
You can try the AnswerDock for free by signing up here: https://answerdock.com/
You will be able to upload your own data and experience most of the features of AnswerDock in the free version.
Leave a Reply