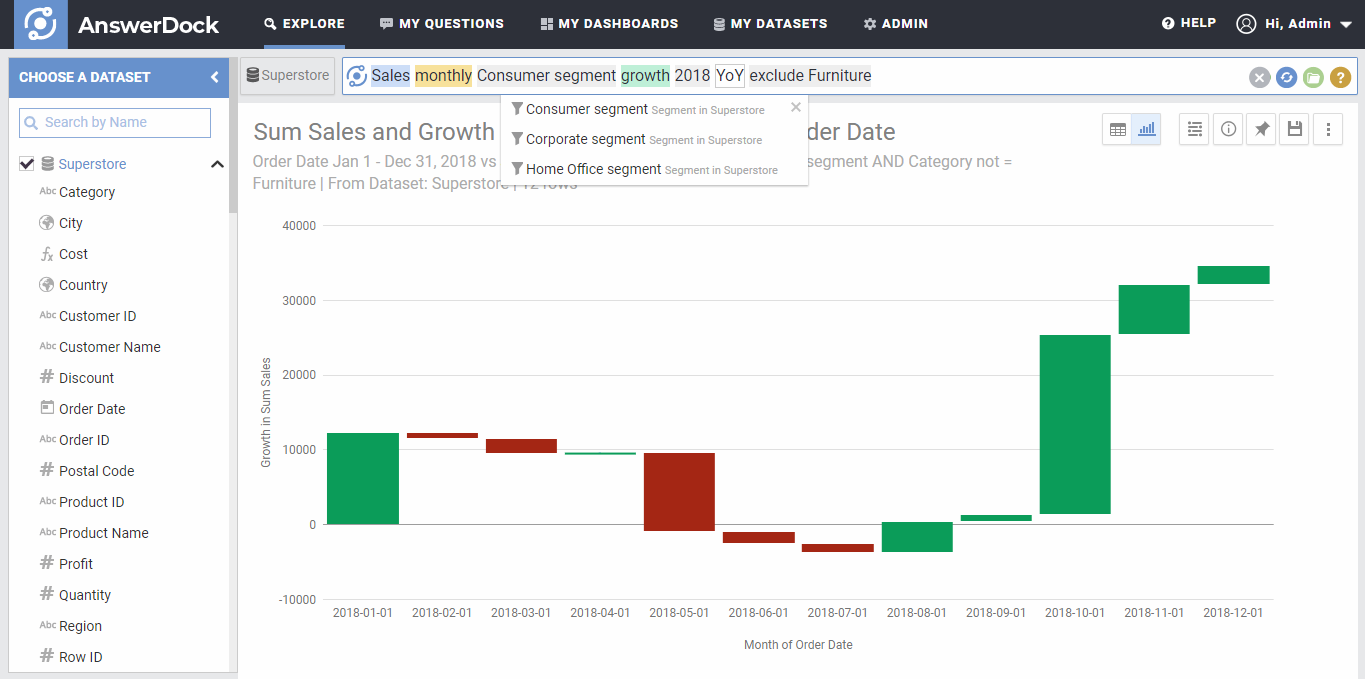
Using the same dataset, we tested the search driven analytics and Natural Language Processing capabilities of Tableau, PowerBi and AnswerDock and compared performance in terms of 1- Ease of Use 2- Charts Available and their relevance to the query (which product produces best chart for the given question) 3- breadth of keywords and calculations that can be done. Using the same dataset, we tested the search driven analytics andRead more

Data visualization software that rely on drag and drop functionality seem fairly easy and straightforward. Many solutions stand out in their pretty charts and easy to use web based interface. The reality is, however, that “drag and drop” Data Visualization (Vs Search-Based Analytics) falls short on two main points: 1- Can still be hard to use for the average user doing medium to advanced analysis. Even as easy asRead more

To answer such a question its very important to define what current modern BI / Data analytics and visualization solutions do and what Next Generation BI tools should be able to do. In summary, current Bi tools and data visualizations (such as Tableau, Qlik view, Domo, etc..) offer the following 1- Drag and drop chart builders 2- Plenty of visualization and chart options 3- Plenty of connectors to differentRead more