What defines the next generation Data Analytics solutions?

To answer such a question its very important to define what current modern BI / Data analytics and visualization solutions do and what Next Generation BI tools should be able to do.
In summary, current Bi tools and data visualizations (such as Tableau, Qlik view, Domo, etc..) offer the following
1- Drag and drop chart builders
2- Plenty of visualization and chart options
3- Plenty of connectors to different data sources
4- Collaboration with other users in organization
5- Creating dashboards and storyboards.
6- Data governance, privileges and permissions management (controlling who does what)
The above features are becoming the minimum for any BI tool. So what is next for BI and Data Analytics ? At AnswerDock, we thought about this in detail and designed our product to cover what we think would be the future for BI:
1- Search-Based or Natural Language Processing
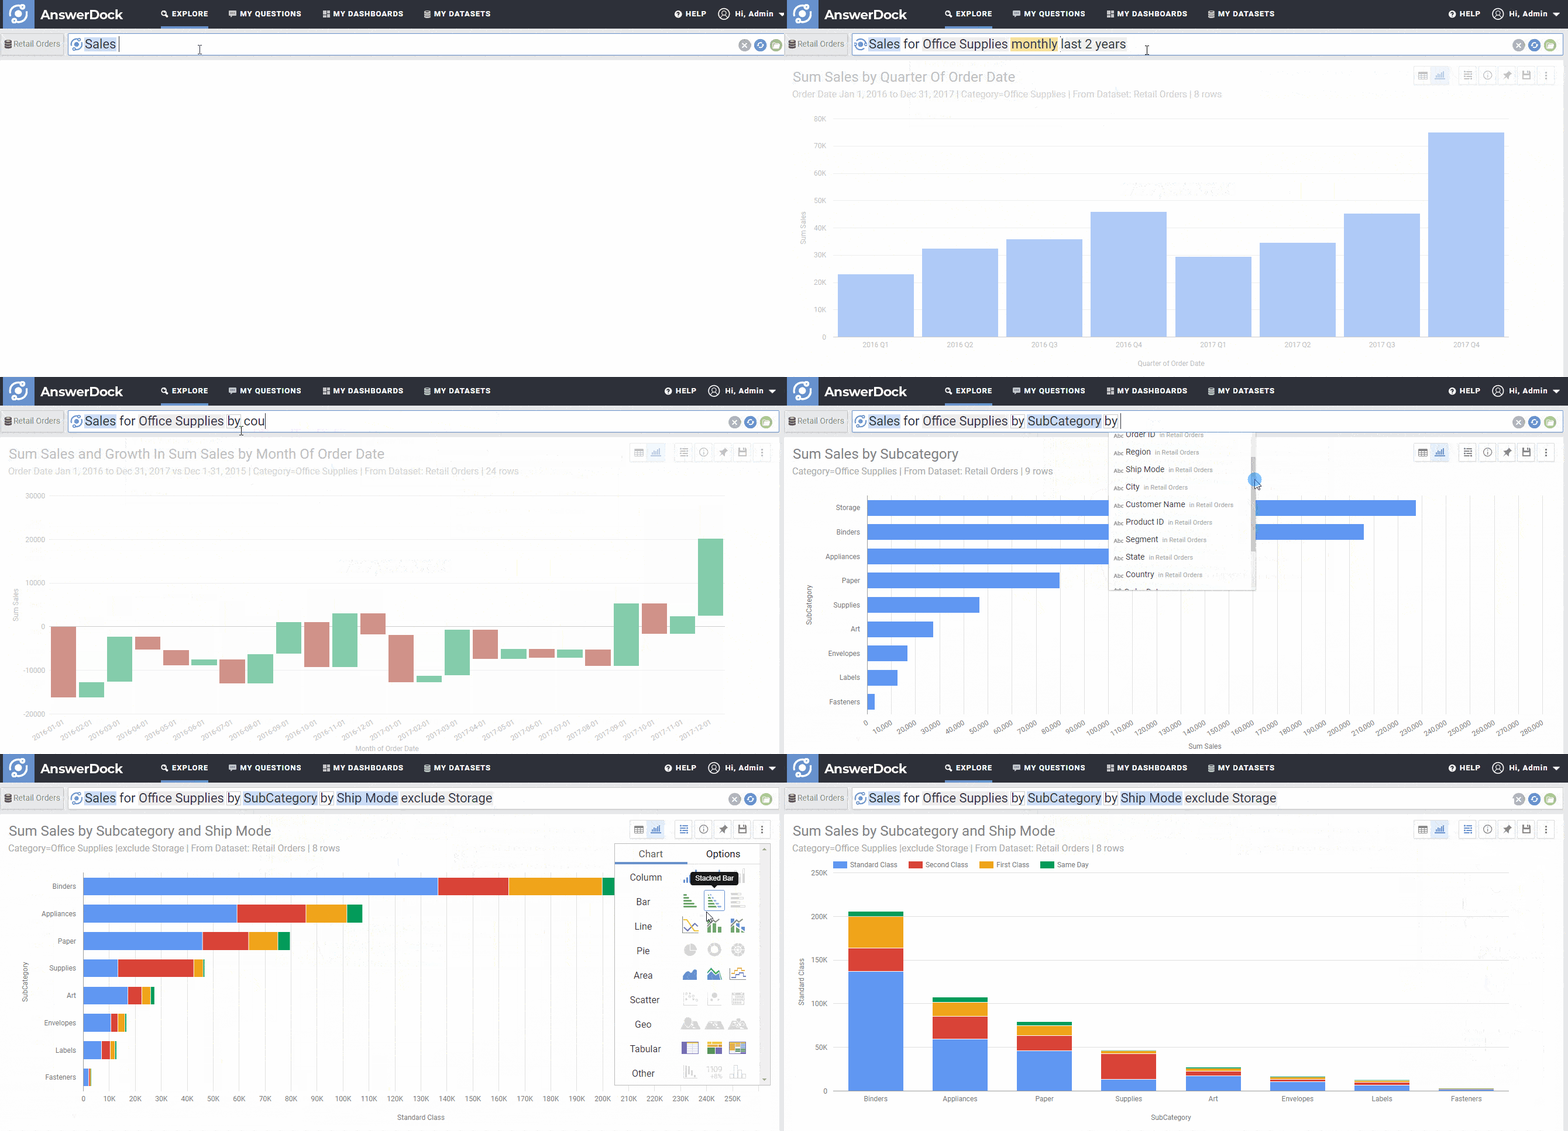
Drag and drop feature is nice and straightforward. However, users need a more intuitive approach to generate and build visualizations, in a similar way they use a search Engine, or even ask a data analyst for a report. The tool would process the question and generate the best chart that represents the data, instantly. Below are some examples of questions users might ask:
- Top 10 Sales People by growth in number of leads this quarter.
- Which countries had highest sales in electronics last year?
- Monthly yoy growth in profit by subcategory excluding furniture jan to september 2018
- sales month to date vs last month
We think the ability for users to type questions or searches is a much more intuitive approach to data analysis and a key feature for differentiated Bi platforms.
2- Going beyond basic analytics: Instant Data mining and insight discovery
At AnswerDock, we consider data visualization as “basic” requirement for any BI solution. What we are mostly excited about is the ability to answer questions that require algorithms for run and answer the question. Below are two examples to explain this:
Example 1: Anomaly detection:
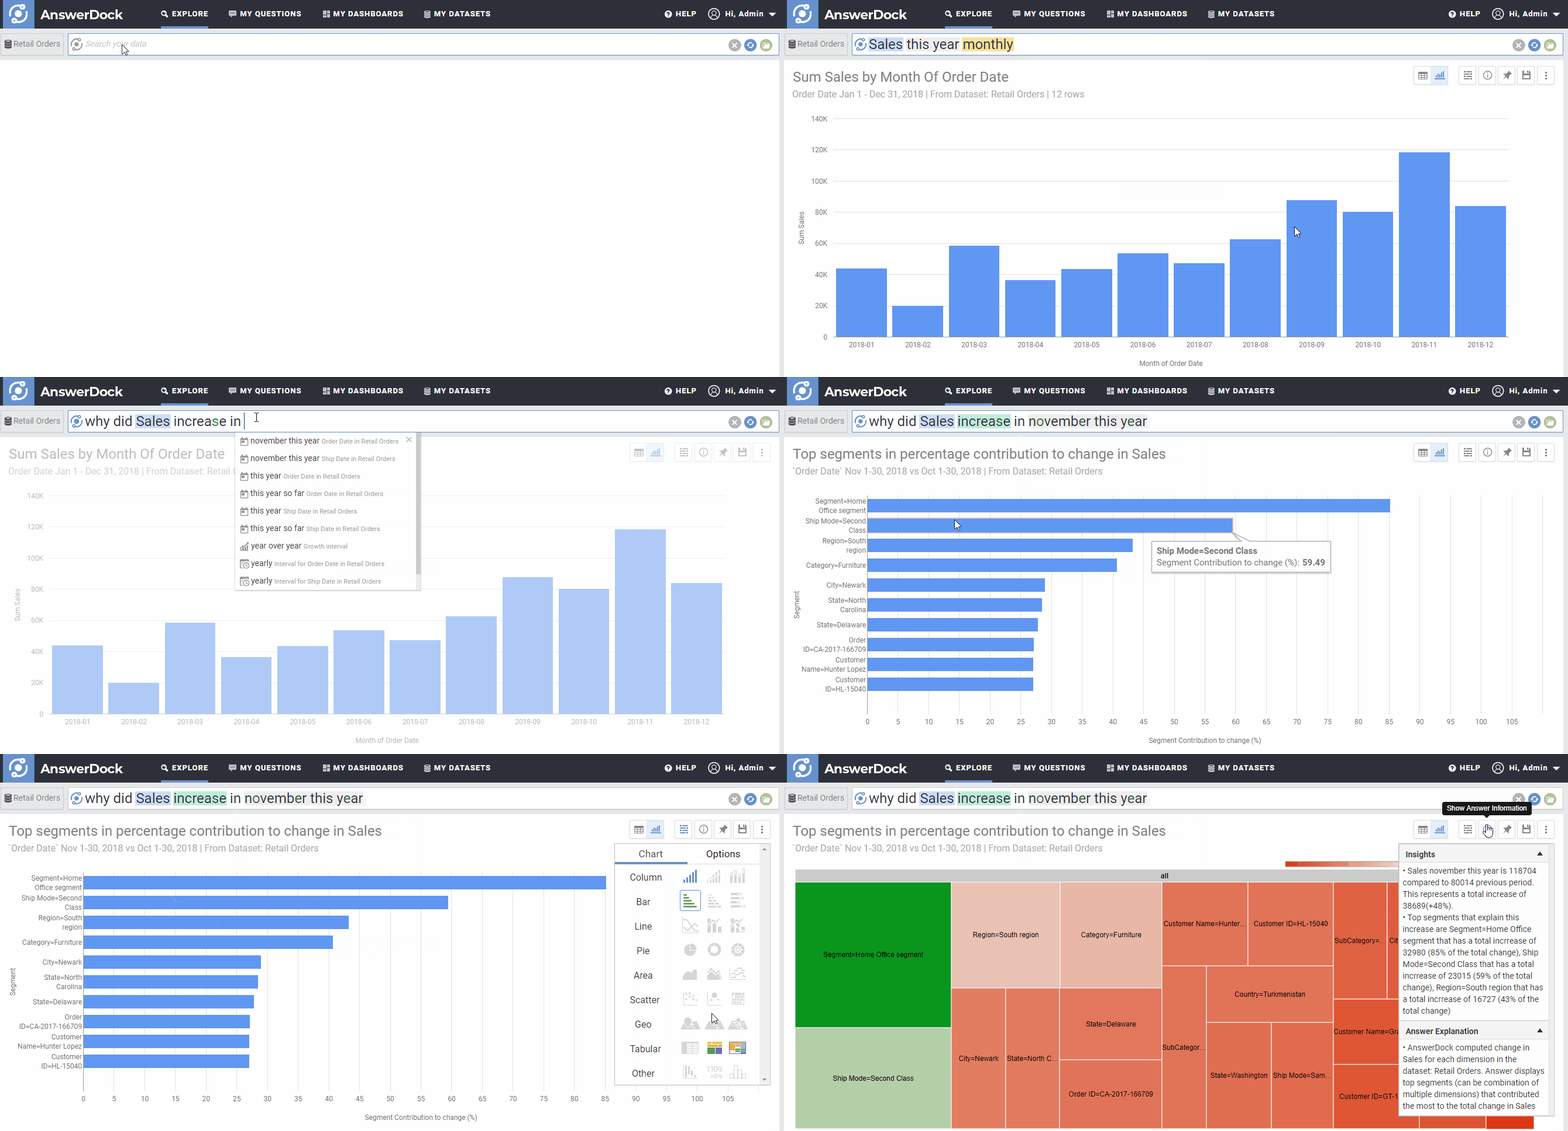
You have a sales dataset with 10+ dimensions (regions, countries, cities, categories, subcateogries, etc..). You sales chart shows a hike in sales in thins month. You want to understand why. Below are your options to investigate:
Using a typical BI tool (e.g. Tableau). You ll need to build a sales chart for this month vs last month and then try each and every dimension, keep disecting your data by each dimension (and sometimes multiple dimensions together), to be able to pinpoint exactly which dimension segment had the biggest increase.
Using AnswerDock: You simply ask: Why did sales increase this month. AnswerDock will run the analysis for each segment (of a simgle or multiple dimension) to tell you exactly that the increase mostly came from region x, category b for example.
Example 2: Discovering drivers and trends:
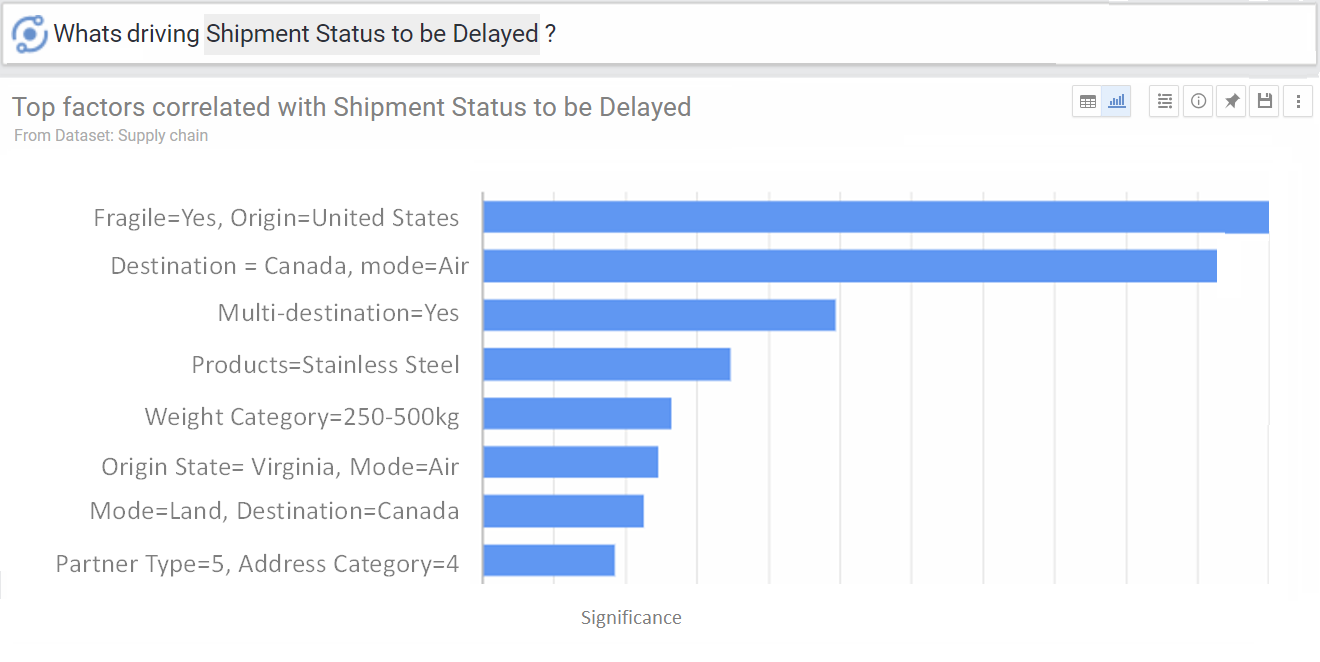
You have a dataset of shipments and you want to know what are the common fac really no way of answering such a question in current BI and data visualization tools (e.g. Tableau, powerbi, etc..). You tors in delayed shipments.
As simple (and valid from a business point of view) this question may sound, there iswill need to again manually dissect the data by different dimensions to try to find the trends and factors that drive delayed shipments (sometimes finding them by luck).
In the old days, a BI specialist would create and train a model, then run it and extract insights or trends using decision rules algorithm (for example).
Using AnswerDock, you can simply ask: “What makes shipment status=delayed?” AnswerDock will pick the right algorithm to answer and come up with the drivers and present them for you.

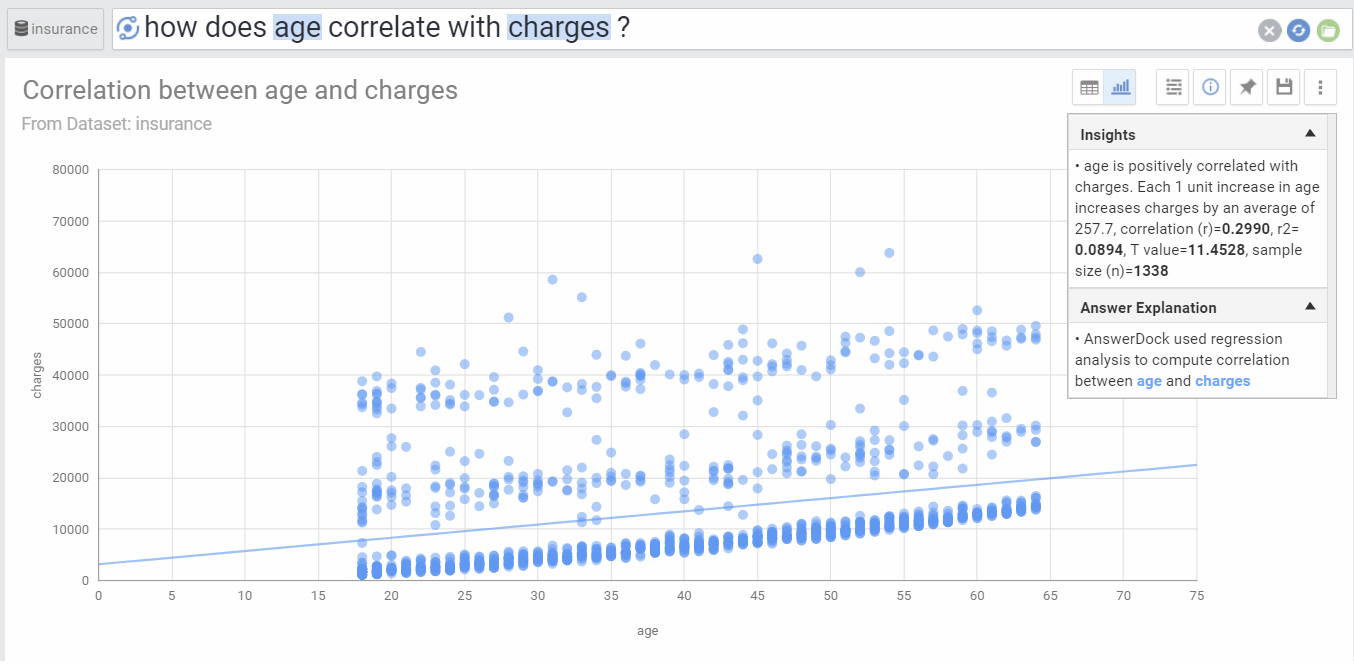
Example 3: Discovering correlations: You have a data set of paying customers and would like to know whether older customers are paying more. This requires a regression analysis to see if there is a statistically significant relation. You can do this with statistics software or with data visualization tools. However, its the easiest to do in AnswerDock. You can just ask: How does age affect charges?

In summary, the winning next generation Bi tools are the ones who will be able to automate insight discovery in the most intuitive way. You can try AnswerDock on your own data for free here


Leave a Reply